Explore the latest insights from top science journals in the Muser Press daily roundup, featuring impactful research on climate change challenges.
Table of Contents
Mountain permafrost is warming across Europe
Roman Oester | SLF – Permafrost temperatures in Europe’s mountain regions are rising steadily, in some cases by more than 1 °C over the last decade. The results of a new study show larger and faster changes than before.
A data set of 64 measurement series from nine European countries, from Svalbard in the far North to the Alps and the Sierra Nevada in southern Spain, on permafrost temperatures in Europe’s mountains has been collected and analyzed by over twenty permafrost researchers under the leadership of SLF scientist Jeannette Nötzli.
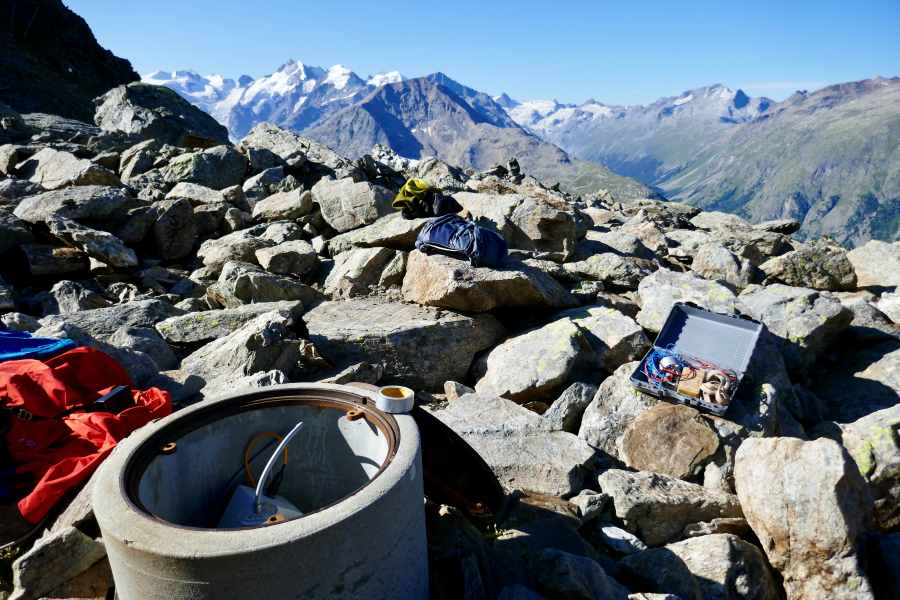
They presented the results in a study published in Nature Communications. The results clearly shows for the first time that mountain permafrost is getting warmer throughout Europe. In the last ten years, the temperature at a depth of ten meters has increased by more than 1° C at some locations.
“The warming of permafrost in the mountains is significant,” says Nötzli, “and it is observed in all regions, depths and time periods that we have looked at.”
The cold regions where permafrost occurs – the high mountains and the polar regions – react particularly sensitively to climate change. The study now shows that the increase in permafrost temperatures in the mountain regions of Europe is partly similar to that in the Arctic: the researchers observed the greatest warming at the highest and northernmost locations. When temperatures in the ice-rich permafrost rise towards 0 °C, the warming slows down significantly and almost comes to a halt because the energy is needed to melt the ice ground. Once the ice in the permafrost has melted, temperatures rise again.
Thanks to international cooperation, Jeannette Nötzli and her team were able to draw on decades of data from European mountains, which are measured at a depth of at least ten meters.
“This large data set is unique and highly valuable,” explains Nötzli. Collecting data in harsh and cold mountain environments and over many years is time-consuming work and requires a lot of commitment. Such time series and their evaluation are an important basis not only for research, but also for local authorities. The increasing changes and the potential consequences for natural hazards and infrastructure are a major challenge in many mountain regions.
Like the measurements, the warming of the permafrost also continues. “This can also be seen from the fact that the warming at a depth of ten meters is stronger than deeper in the ground,” says Jeannette Nötzli. Further down in the ground, temperatures react to climate change with increasing delay. The observed warming will continue to penetrate to greater depths in the coming decades.
What is… permafrost?
Permafrost is ground such as rock, debris or moraine that has temperatures below 0°C throughout and is therefore permanently frozen. Permafrost covers some five percent of Switzerland’s territory and is mainly found in scree slopes and rock walls in cold locations at elevations above 2,500 metres above sea level.
Journal Reference:
Noetzli, J., Isaksen, K., Barnett, J. et al. ‘Enhanced warming of European mountain permafrost in the early 21st century’, Nature Communications 15, 10508 (2024). DOI: 10.1038/s41467-024-54831-9
Article Source:
Press Release/Material by Swiss Federal Research Institute (WSL) | Institute for Snow and Avalanche Research (SLF)
Tourism leads the pack in growing carbon emissions
University of Queensland – A University of Queensland-led study shows greenhouse gas emissions from tourism have been growing more than 2 times faster than those from the rest of the global economy.
Associate Professor Ya-Yen Sun from UQ’s Business School said rapid expansion in travel demand has meant carbon from tourism activities accounts for 9% of the world’s total emissions.
“Without urgent interventions in the global tourism industry, we anticipate annual increases in emissions of 3 to 4% meaning they will double every 20 years,” Dr Sun said. “This does not comply with the Paris Agreement which requires the sector to reduce its emissions by more than 10% annually. The major drivers behind the increasing emissions are slow technology improvements and a rapid growth in demand.”
The study, published in Nature Communications, involved researchers from UQ, Griffith University, the University of Sydney and Linnaeus University (Sweden), and tracked international and domestic travel for 175 countries.

It found tourism’s global carbon footprint increased from 3.7 gigatonnes (Gt) to 5.2 Gt between 2009 and 2019. The most net emissions were reported in aviation, utilities and private vehicle use for travel.
The emissions growth rate for tourism was 3.5% per annum during the decade while global emissions increased by 1.5% per annum from 50.9 Gt to 59.1 Gt. The United States, China, and India dominated the list and were responsible for 60% of the total increase in tourism emissions across the study period.
Australia ranked in the top 20 countries that together contributed three quarters of the total tourism carbon footprint in 2019.
“The biggest carbon challenge in tourism is air travel,” Dr Sun said. “Reducing long-haul flights is one of the recommendations we’ve put forward to help the industry lower its emissions, along with targeted measures such as carbon dioxide taxes, carbon budgets, and alternative fuel obligations. Cutting back on marketing long-haul travel and identifying a national growth threshold would also help rein in the rapid expansion of emissions.
“At a local level, tourism operators could look to renewable electricity for accommodation, food and recreational activities and switch to electric vehicles for transport. In Australia, if businesses select an electricity plan based on renewables rather than coal, they’ll be reducing their emissions.”
Dr Sun has presented the research findings at a session on Enhanced Climate Action in Tourism the UN Climate Change Conference (COP29) in Azerbaijan.
Research collaborators include Dr Futu Faturay, Professor Manfred Lenzen, Professor Stefan Gössling and Professor James Higham.
Journal Reference:
Sun, YY., Faturay, F., Lenzen, M. et al. ‘Drivers of global tourism carbon emissions’, Nature Communications 15, 10384 (2024). DOI: 10.1038/s41467-024-54582-7
Article Source:
Press Release/Material by University of Queensland
Lake ice becoming increasingly unsafe at start and end of winter, raising risk of drowning
Sandra McLean | York University – Sports and recreational activities on frozen lakes across the Northern Hemisphere are a popular pastime for millions, but according to new research out of York University, the safety of that ice is becoming more precarious and shorter in duration.
The paper was published in PLOS ONE.
As winter and early spring temperatures continue to rise with a warming world the quality of lake ice is changing and that prompted the researchers to delve into available data to project how many fewer days of safe ice there could be in the future. That number could be upwards of 29 days depending on the condition of ice cover and whether the world reaches 1 C, 2 C or even 4 C of warming.
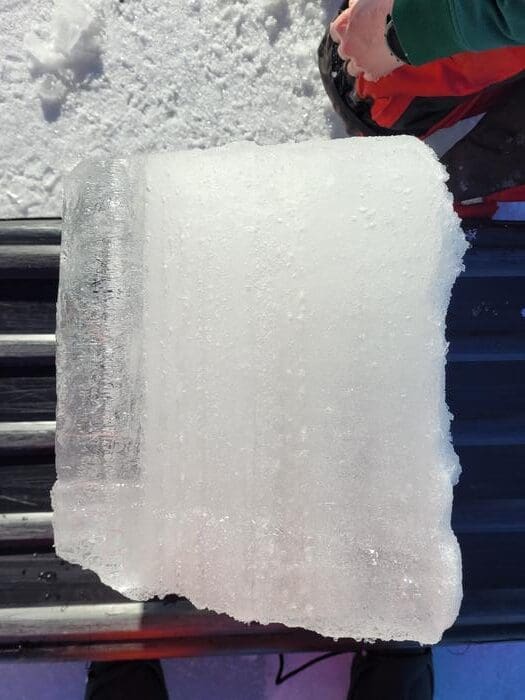
Although their previous work looked at ice thickness and duration, important indicators of ice safety, they are quick to point out that that is only part of the equation. Equally important and potentially as dangerous is the quality of the ice, which also helps determine whether it is safe, especially early and late in the season when the ice is either forming or melting.
“Quality and thickness need to be weighed together when deciding if the ice is safe to go out on. Our research found there will be fewer safe ice days and the formation of safe ice during the transition period in early winter will take longer, creating a higher risk for accidents and drownings,” says Professor Sapna Sharma of York’s Faculty of Science and senior author of the paper.
Led by York Postdoctoral Fellow Joshua Culpepper, the study tracked historical shifts in ice thickness and quality to determine how global temperature rises will affect the number of safe days on the ice.
“We used a lake ice model to examine changes in ice thickness of the Northern Hemisphere between 1850 and 2100,” says Culpepper. “We show that although many lakes are still forecasted to freeze, as warmer temperatures become the norm, they will be unsafe to use for a longer time especially if more white ice, than black ice forms.”
The quality of ice, how strong it is and how much weight it can hold, differs depending on whether it’s predominantly white or black ice.
“White ice conditions increase the risk of falling through the ice as white ice has a lower load bearing capacity compared to black ice at the same thickness,” says Culpepper, who cautions that as the climate heats, white ice conditions are expected to increase.
Shoulder seasons is when it is most unsafe
Lake ice formation in the Northern Hemisphere could be delayed anywhere from Nov. 15 to Jan. 18, dictated by how high average temperatures climb – 1 C, 2 C or 4 C – and it is during this transition that white ice is most likely to form.
“We found lake ice will likely be unsafe longer at the beginning, than the end, of the ice season. Although the lakes will be frozen, they could be unsafe to use for three to four weeks at the beginning of winter and for an extra week at the end when ice is predicted to decay rapidly,” says Sharma.
“This rapid break up of safe ice conditions suggests that the end of the ice season will offer some of the most dangerous conditions, but the beginning of the season is also highly risky. The greatest number of drownings through ice occur at the beginning and end of the ice season and this risk is expected to be higher with climate change.”
How does white ice differ from black ice?
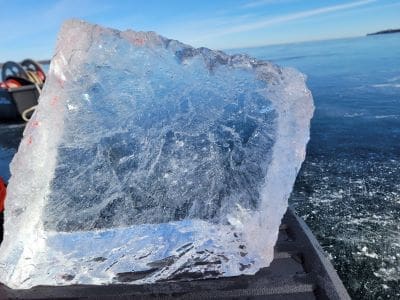
Even though the ice might measure the right thickness to venture out for a skate or snowmobile ride, if it is comprised mainly of white ice, it likely won’t hold. This has already resulted in dozens of drownings, say the researchers.
White ice is more likely to form when temperatures are warmer than usual or there are warm rainy days following very cold days. It is usually opaque, like snow, and filled with more air bubbles, smaller ice crystals, and holds less weight than black ice. At temperatures close to 0 C, it could be more than 50 per cent weaker. Steady cold temperatures are needed for black ice formation, which is clear and dense, has few air pockets and larger ice crystals, making it able to hold heavier loads.
Guidelines on ice thickness for people, snowmobiles, cars and transport trucks on the ice are based on black ice. If people are measuring the ice thickness without accounting for the type of ice, that could lead to life-threatening plunges through the ice.
Lake ice is unsafe when it thins to less than 10 cm of black ice, less than 15 cm of equal parts black and white ice, or less than 20 cm of white ice. The formation of white ice is expected to increase as temperatures climb increasing the unsafe transition period.
In Canada last December, six people, including a couple of teens in Ontario, died within a week plunging through thin ice. Two more died in Ontario this February. In Finland, four people died from falling through weak ice in January and February alone, where the average is said to be 18 people annually. In Sweden, 16 people drowned from falling through the ice in 2014 and at least nine in 2021, for example.
The researchers hope to get the word out on the increasing precariousness of lake ice today and into the future, and hope people will take precautions before venturing onto the ice, even if it looks solid enough.
Journal Reference:
Culpepper J, Huang L, Woolway RI, Sharma S, ‘Widespread loss of safe lake ice access in response to a warming climate’, PLoS ONE 19 (12): e0313994 (2024). DOI: 10.1371/journal.pone.0313994
Article Source:
Press Release/Material by York University
Wildfire surges in East, Southeast US fueled by new trees and shrubs
American Geophysical Union – The eastern U.S. has more trees and shrubs than three decades ago. This growth, driven by processes such as tree and understory infilling in unmanaged forests, is helping fuel wildfires, contributing to changing fire regimes in the eastern half of the country, according to a new study.
Some parts of the eastern and southeastern United States have experienced a tenfold increase in the frequency of large wildfires over the last forty years, with Texas and the Appalachians seeing the largest increase. However, the Northeast lacked a tie between woody plant growth and large wildfires.
Wildfires thrive on woody vegetation such as trees and shrubs. The new analysis of wildfire and vegetation data shows that the eastern U.S. has seen a 37% increase in woody cover over the last 30 years. In some regions, high levels of woody cover are linked directly to a higher risk of large wildfires over the same period.
The research “is helping us narrow in on regional drivers and focus our efforts to preemptively get ahead of the growing wildfire problem here in the eastern U.S.,” said Victoria Donovan, a landscape ecologist at the University of Florida who was the senior author on the study.
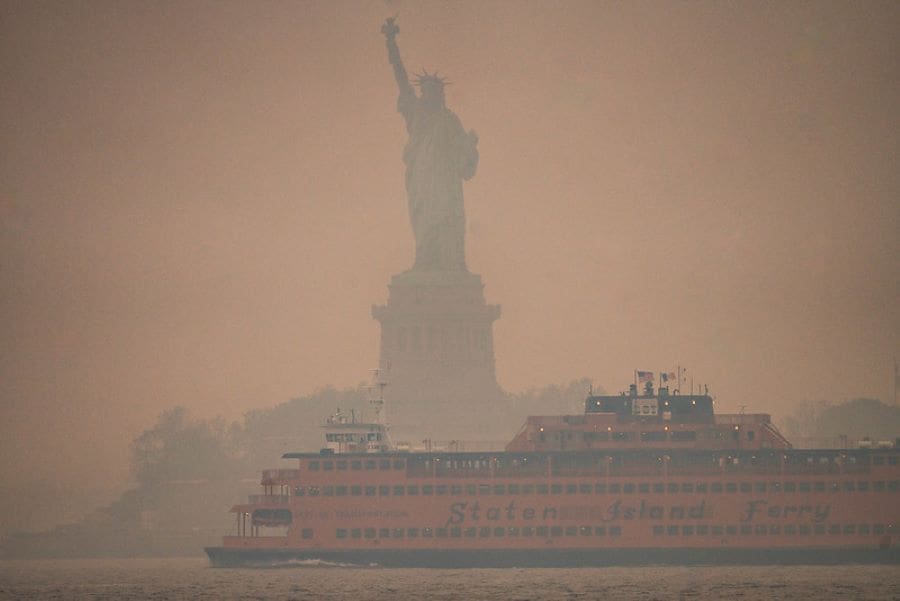
The study was published in Geophysical Research Letters, an open-access AGU journal that publishes high-impact, short-format reports with immediate implications spanning all Earth and space sciences.
Research has shown that woody cover growing in new places or thickening within forests is directly linked to increased wildfire risk in western and central parts of the country. But whether this is true out East has yet to be explored.
To test this, Donovan and her graduate student Michaella Ivey collected data on all wildfires between 1991 and 2021 that were at least 200 hectares – around 500 football fields – or larger in eastern states. They then looked where trees and shrubs were growing in the eastern U.S over the same period. To determine if woody cover influenced wildfire risk, the researchers compared the amount of woody cover within wildfire perimeters to what would be expected if wildfires were distributed at random.
The analysis revealed a strong link between woody cover and large wildfire occurrence – but only in some parts of the country. Across the eastern temperate forest, a region that makes up nearly half of the United States, each 1% increase in woody cover led to an overall 3.9% increase in the odds of a wildfire the next year. The link between woody cover and wildfire risk was strongest in eastern Texas and in and around the Appalachian Mountains.
However, the researchers found no link between woody cover and wildfire risk in the Northeast and across some parts of the Mississippi River valley. This finding “prompts all sorts of questions about what other factors are influencing the system,” Ivey said.
Cooler and wetter conditions in the Northeast, and to some extent the Mississippi River valley, may create conditions less conducive to wildfire. However, many Northeastern ecoregions could not be included in the study due to a low number of wildfires that were large enough to meet the study’s size requirements. Wildfires in these areas may stay small because of agricultural fragmentation, the researchers said.
Because woody vegetation wasn’t tied to wildfire increase consistently throughout the study area, climate change, human actions, or a combination of the two could be more important for wildfires than vegetation in some places. But overall, the research suggests that reducing fuels is a good tactic for reducing wildfire risk in the east, Donovan said.
More prescribed fires may be necessary in southern states as climate change is expected to make the southeast drier, and potentially more prone to wildfires, the researchers caution. This research shows a path forward for states and individuals to help reduce wildfire risk in the future.
“Using fuel management to reduce wildfire risk is a lot more actionable than changing the climate pattern in the short term,” Donovan said, “though addressing climate change will likely be crucial for reducing wildfire risk in the east in the long term.”
Journal Reference:
Michaella A. Ivey, Carissa L. Wonkka, Noah C. Weidig, Victoria M. Donovan, ‘Woody Cover Fuels Large Wildfire Risk in the Eastern US’, Geophysical Research Letters 51, 24, e2024GL110586 (2024). DOI: 10.1029/2024GL110586
Article Source:
Press Release/Material by American Geophysical Union (AGU)
The high cost of carbon
Kat Kerlin | University of California, Davis – The social cost of carbon – an important figure that global policymakers use to analyze the benefits of climate and energy policies – is too low, according to a study led by the University of California, Davis.
The study, published in the journal Proceedings of the National Academy of Sciences (PNAS), shows that current estimates for the social cost of carbon, or SCC, fail to adequately represent important channels by which climate change could affect human welfare. When included, the SCC increases to just over $280 per ton of CO2 emitted in 2020 — more than double the average published in the academic literature. The study’s estimate is also larger than the U.S. Environmental Protection Agency’s central estimate of $190 per ton of CO2.
“When people worry about climate change, they worry about the risk and uncertainty it causes,” said lead author Frances Moore, an associate professor in the Department of Environmental Science and Policy at UC Davis. “They worry about long-term, persistent accumulating effects, such as climate change acting as a drag on economic growth. They worry about impacts to very unique natural systems or cultural heritage that are just irreplaceable. Those are what keep people up at night about climate change, and those are not fully included in SCC estimates currently used for policymaking.”

Climate change and the damage done
The social cost of carbon quantifies the damage a ton of carbon dioxide has on society and the economy, including food production, human health, property damage due to natural disasters, and impacts to natural systems. Estimates of the SCC are used widely in policy analysis, particularly to value the benefits of reducing greenhouse gas emissions. The United States, Germany, Canada and several states all have official SCC estimates used for policy making.
Most current government estimates, the study said, are incomplete and likely underestimate the benefits of reducing greenhouse gas emissions. This is because they omit some important ways climate change can affect human welfare, including via economic growth or effects on unique natural systems.
The study combines evidence from both the published literature and a survey of experts to fully integrate these elements into the SCC estimate, providing the most comprehensive assessment of SCC estimates to date.
Accounting for omissions
For the study, the authors synthesized 1,800 SCC estimates from the academic literature over the past 20 years and found a wide range of published values averaging $132 per ton of CO2.
The scientists also conducted an expert survey with the authors of the literature, who said they thought the true value of the SCC was likely twice as large as the average of published values. Experts attribute this to a range of omissions in the academic literature, including limited representation of climate tipping points, effects on scarce ecosystems, or climate impacts with long-lived effects on the economy such as impacts on economic growth.
The authors then used machine learning to re-weight the literature, partially correcting some of the omissions identified by experts and using more recent evidence on discount rates. This produced a distribution of the 2020 SCC with a mean of $283 per ton of CO2 and an interquartile range of $97 to $369.
The study states: “Incorporating climate costs into the prices of economic activities that emit greenhouse gases, either directly through carbon pricing or indirectly through emission regulation or subsidies of cleaner alternatives, is essential for averting the worst climate outcomes.”
The study’s coauthors are Moritz Drupp from the University of Hamburg, James Rising from the University of Delaware, Simon Dietz from the London School of Economics and Political Science, Ivan Rudik from Cornell University, and Gernot Wagner from Columbia Business School.
Journal Reference:
F.C. Moore, M.A. Drupp, J. Rising, S. Dietz, I. Rudik, G. Wagner, ‘Synthesis of evidence yields high social cost of carbon due to structural model variation and uncertainties’, Proceedings of the National Academy of Sciences 121 (52) e2410733121 (2024). DOI: 10.1073/pnas.2410733121
Article Source:
Press Release/Material by University of California – Davis
Researchers explore carbon capture in fish farms to address climate change
Sarah Al-Arshani | University of Connecticut – Scientists are exploring a new model for carbon capture in low-oxygen aquatic environments, such as fisheries, that will help address rising global temperatures and could potentially be cost-effective, a recent study published in Nature Food said.
Lead researcher Mojtaba Fakhraee, an assistant professor of Earth sciences who will begin his appointment in August 2025, says traditional methods of reducing emissions are no longer sufficient to keep global temperature increases below 2 degrees Celsius, a goal set by the Paris Agreement.
In recent years, scientists have turned to carbon capture – the process of capturing CO2 emissions from industrial sources – as a possible solution to address climate change alongside traditional efforts to reduce carbon emissions.
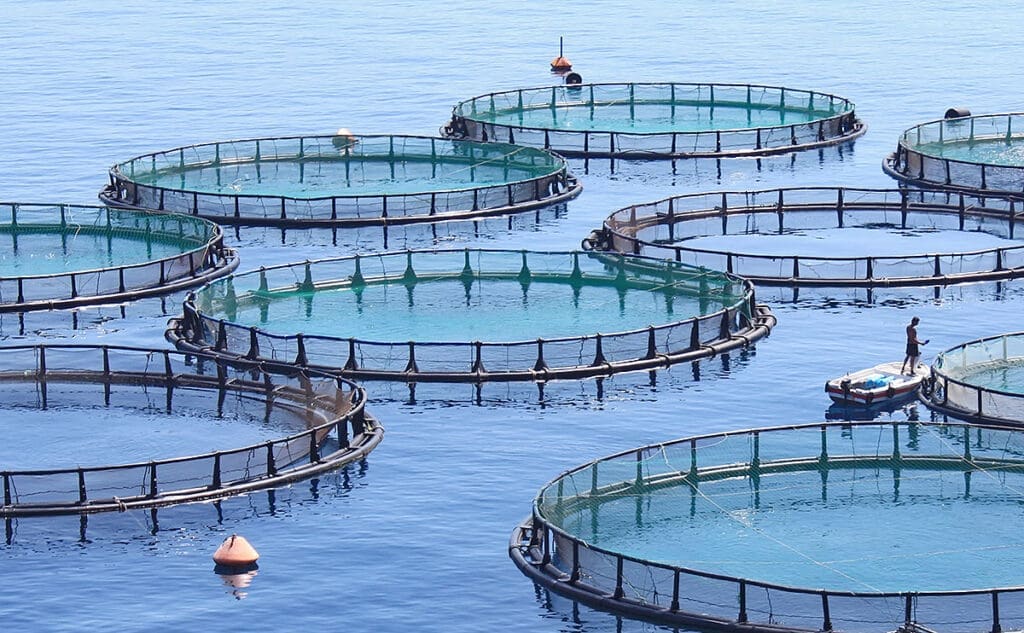
Fakhraee, working with Noah Planavsky, professor of Earth and planetary sciences at Yale University, developed a model to explore how alkalinity production through enhanced iron sulfide formation in fish farms and other low-oxygen aquatic environments could offer a low-cost and efficient way to capture at least 100 million metric tons of CO2 annually.
“We are in the situation right now that to be able to sustain that 1.5 degree threshold, we should be removing carbon from the atmosphere,” Fakhraee says. “There is no way around this point.”
Fakhraee says the study focuses on fish farms because they are directly influenced by human activities and can be an ideal place for capturing carbon while reducing toxic sulfide concentrations.
The researchers’ model found that adding iron, which reacts with accumulated hydrogen sulfide, increases alkalinity. This, in turn, raises carbonate saturation levels, enhancing the capture of CO2 from the environment.
This model would be most effective in countries like China and Indonesia, which have abundant fish farms, the authors note. Fakhraee and Planavsky estimate that China alone could remove nearly 100 million metric tons of CO2 per year from the atmosphere.
Fakhraee says this finding will also positively impact the success of fish farms, as the buildup of hydrogen sulfide can be toxic to fish, leading to increased mortality rates or fish becoming too sick to sell. The proposed model would reduce this toxicity, leading to larger fish populations and more sustainable, profitable operations.
He added that this approach could be more effective than other methods of carbon capture because it would essentially permanently store the carbon.
“It’s going to be stored on a time scale of thousands of years, which is much longer than the lifetime of CO2 in the atmosphere,” he says.
Fakhraee says this is only one approach to carbon capture. However, if put into practice, it could make a significant impact on carbon emissions from fish farms.
“This is just one possible pathway for carbon capture at a significant scale,” he says. “The co-benefit for this specific pathway is that it would help with neutralizing the carbon emissions from fish farms resulting in a more sustainable fish industry.”
Journal Reference:
Fakhraee, M., Planavsky, N.J., ‘Enhanced sulfide burial in low-oxygen aquatic environments could offset the carbon footprint of aquaculture production’, Nature Food 5, 988–994 (2024). DOI: 10.1038/s43016-024-01077-9
Article Source:
Press Release/Material by University of Connecticut
Featured image credit: Gerd Altmann | Pixabay


