Antarctic sea ice has been declining at an alarming rate, with minimum extents reaching record lows in recent years. This ongoing reduction has widespread consequences, influencing global ocean circulation, weather patterns, and marine ecosystems.
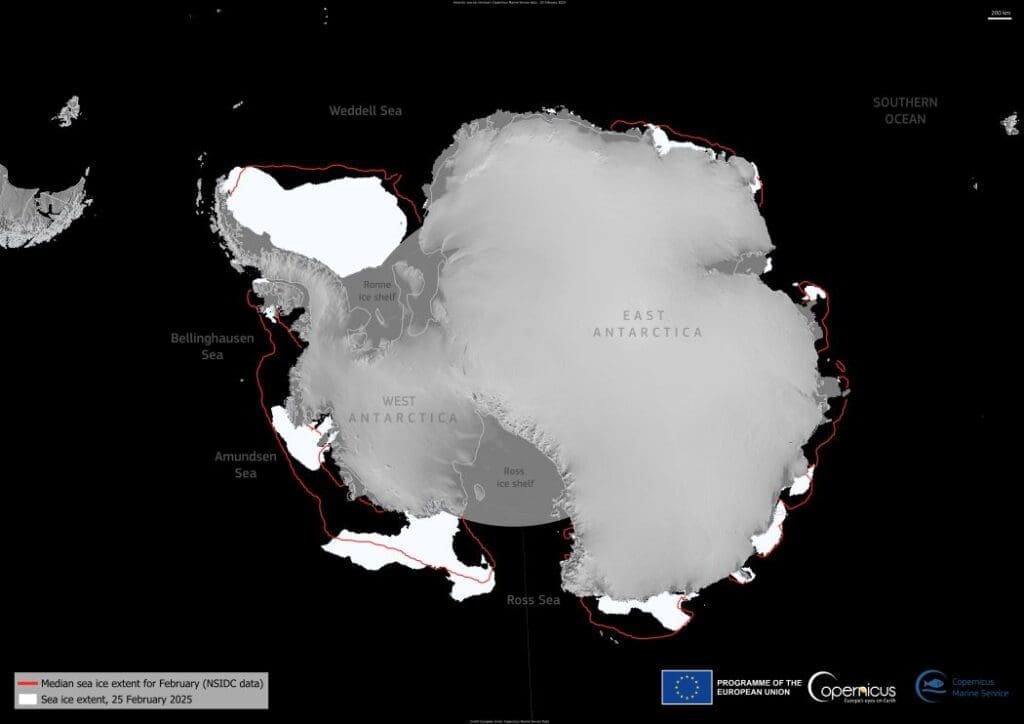
On 25 February 2025, Antarctic sea ice reached its minimum extent for the year at 1.87 million km2, tying with 2024 as the seventh lowest minimum on record. Data from the Copernicus Marine Service (CMEMS) indicates that this is 8% below the 1993–2010 average, continuing a trend of shrinking ice cover since 2017.

Sea ice in the Antarctic follows a seasonal cycle, expanding during the colder months of the Southern Hemisphere’s winter (April–September) and retreating in the summer (October–March). However, recent observations show increasing variability, with some years experiencing sharp and unprecedented declines in ice coverage.
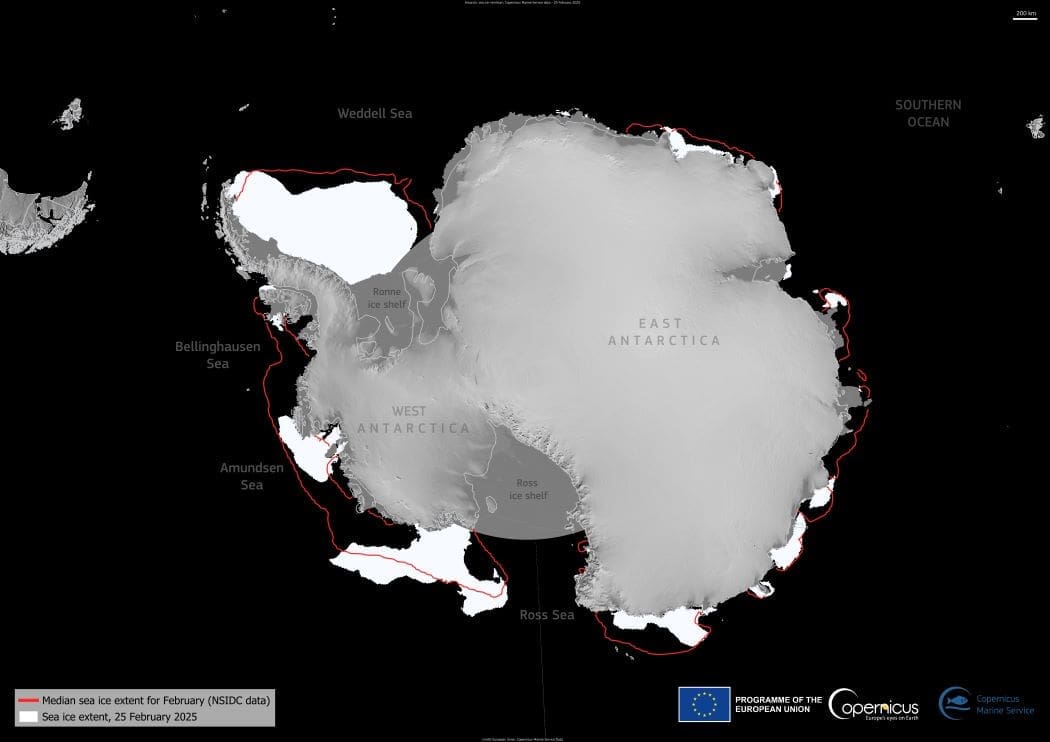
The distribution of sea ice on 25 February 2025 highlights these regional variations. While some areas, such as parts of the Weddell Sea and the coastlines of the Bellingshausen Sea, Wilkes Land, and Amery Land, retained significant ice coverage, others showed extensive melting. This uneven loss of ice reflects complex interactions between ocean temperatures, wind patterns, and climate variability.
Long-term decline raises concerns
The 2025 data confirms a continued downward trend in Antarctic sea ice, with both extent and volume remaining well below historical averages. Since satellite records began 32 years ago, the five lowest Antarctic sea ice minimums have all occurred since 2017. Additionally, 2025 marks the second consecutive year with a sea ice minimum below 2 million km2, underscoring the persistence of this trend.
Tracking these changes is essential for understanding their impact on global ocean dynamics, climate patterns, and ecosystems. The Copernicus Marine Service, through its monitoring efforts, provides crucial data to support scientific research, climate policy, and environmental management.
Featured image credit: European Union, Copernicus Marine Service Data


