Explore the latest insights from top science journals in the Muser Press daily roundup, featuring impactful research on climate change challenges.
In brief:
Protected habitats aren’t enough to save endangered species
In tropical forests, endangered species inside protected habitats are still in danger from threats from beyond their sanctuaries, according to a study published in the open-access journal PLOS Biology by Ilaria Greco and Francesco Rovero of the University of Florence, Italy, and colleagues.
Tropical forests contain the majority of Earth’s biodiversity, but they are also home to high concentrations of threatened species. Worldwide, governments are committing to establishing more protected wildlife areas through initiatives like the Kunming-Montreal Global Biodiversity Framework, but there is evidence to suggest that species within such protected areas might still be impacted by threats outside these borders.
In this study, Greco and colleagues assess how mammalian communities are impacted by wide-ranging anthropogenic impacts.

The researchers collected data from nearly 560,000 camera-trap images of 239 mammal species in tropical forests in Asia, Africa, and the Americas. In each area, they measured the richness and distribution of the mammalian community and tested how those metrics responded to human population density and habitat disturbance in surrounding areas.
Human population density had a strong effect on the number of mammal species in an area. Even with the wildlife restricted within a protected area and the human population outside, the study’s model predicts a 1% decline in species richness for every 16 persons per square kilometer on the surrounding landscape. Mammal communities were also negatively impacted by forest loss and fragmentation within 50 kilometers of their forest homes.
These results show that communities within a protected habitat can still be negatively impacted by anthropogenic disturbances in the wider surrounding landscape. The authors suggest that establishing protected areas alone is not sufficient to conserve wildlife, and that these efforts can be complemented with broader measures such as preventing wide-scale forest loss and restoring habitat connectivity across the landscape.
“Our results,” says Ilaria Greco, “suggest the existence of anthropogenic extinction filtering acting on mammals in tropical forests, whereby human overpopulation has driven the most sensitive species to local extinction while remaining ones are able to persist, or even thrive, in highly populated landscapes and mainly depend on habitat cover.”
“The study warns that conservation of many mammals in tropical forests depends on mitigating the complex detrimental effects of anthropogenic pressures well beyond protected area borders,” adds Francesco Rovero.
Journal Reference:
Greco I, Beaudrot L, Sutherland C, Tenan S, Hsieh C, Gorczynski D, et al., ‘Landscape-level human disturbance results in loss and contraction of mammalian populations in tropical forests’, PLoS Biology 23 (2): e3002976 (2025). DOI: 10.1371/journal.pbio.3002976
Article Source:
Press Release/Material by PLOS
New England’s salt marshes store the carbon equivalent of 10 million cars – and add another 15,000 every year
In the race to combat global climate change, much attention has been given to natural “carbon sinks”: those primarily terrestrial areas of the globe that absorb and sequester more carbon than they release. While scientists have long known that coastal salt marshes are just such a sink for “blue carbon,” or carbon stored in the ocean and coastal ecosystems, it has been difficult to get an accurate estimate of just how much they store, and so most of the focus has been on terrestrial sinks such as forests and grasslands.

Now, a team of scientists at the University of Massachusetts Amherst recently debuted a new, highly accurate method for quantifying carbon capture in the Northeast’s salt marshes — and it’s a lot.
Their work shows that salt marshes store approximately 10 million cars’ worth of carbon in their top meter of soil and suggests that saltmarshes add approximately 15,000 additional cars’ worth every year.
The results, published in the Journal of Geophysical Research: Biogeosciences, are an important step toward meeting the challenges of a warming world.
The ocean stores nearly a third of industrial carbon dioxide emissions, and there is a growing global appreciation for the role that coastal ecosystems like salt marshes play as carbon sinks.
“The amazing thing about tidal marshes, from a climate perspective,” says Wenxiu Teng, lead author of the paper and a Ph.D. candidate in the Department of Earth, Geographic and Climate Sciences (EGCS) at UMass Amherst, “is that they can continuously increase their carbon storage. They don’t fill up.”
This is because wave-by-wave, tide-by-tide, storm-by-storm, new layers of carbon-trapping sediment are continually stored in the thick salt marsh grasses. Furthermore, as glaciers continue to melt, salt marshes grow vertically in order to keep up with rising sea levels, thus storing even more carbon.
“Salt marshes are far more persistent carbon sinks than forests or other terrestrial sites,” says Brian Yellen, Massachusetts’s state geologist, research assistant professor at UMass Amherst and one of the paper’s coauthors. “There are many people who are excited about technological solutions to scrub carbon from the atmosphere, but here we have a natural one that works, and works very well, right now. Our work helps to clarify the size of this natural carbon sink and provides a method that is scalable to other regions of the world.”
The team’s work also holds a warning — that 10 millions cars’ worth of carbon is also a potential carbon bomb. If the salt marshes are disturbed or their natural processes altered, they could release all those greenhouse gasses, exacerbating climate change, rather than helping to naturally mitigate it.
“If salt marshes were to degrade due to the combined threats of local environmental stressors and global climate change,” says Yellen, “they would become huge sources of carbon emissions.”

To figure out how much blue carbon salt marshes can hold, scientists need both a baseline for how much has already been stored and an accurate way to measure the rate at which the marshes can sequester carbon. Both have been very difficult to pinpoint, in part because marshes themselves are highly variable ecosystems with diverse storage rates. The ideal would be to take a soil sample from every meter of every marsh and measure the carbon stored in it — a prohibitively expensive and time-consuming process.
Another option would be to turn to satellite images, but, notes Qian Yu, EGCS associate professor and one of the paper’s co-authors, satellites, powerful as they are, can’t see the carbon stored in the salt marsh’s sediment itself. However, satellites can see variable water depth and vegetation across the marsh, the two main factors that driving marsh soil formation and carbon storage.
The team used a common tool from the satellite remote sensing world called the Normalized Difference Water Index (NDWI) to look at spatial patterns of water depth and vegetative vigor to map out soil differences across marshes. Yet, the NDWI constantly fluctuates with seasonal vegetation growth and tidal changes.
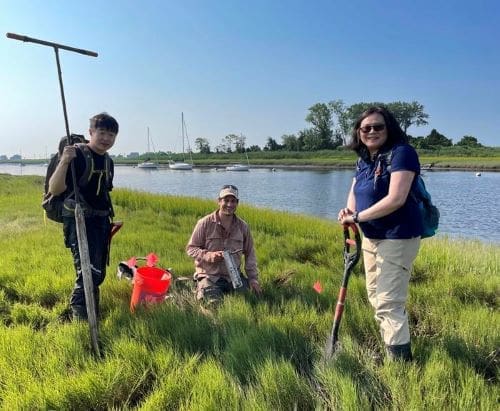
What the team realized it needed to do was to compare satellite NDWI data from multiple seasons and different tidal levels against a robust sample of salt marsh sediment gathered in the field — which they had already done, travelling to 19 sites from Long Island Sound to the Gulf of Maine and collecting 410 samples representing multiple locations in each salt marsh.
“We started looking at the satellite data plotted against the field samples, and we had this ‘a-ha!’ moment,” says Yellen. The team could clearly see that there were particular tidal conditions and times of year where the satellite data closely tracked the data they had gathered in the field.
“It’s really all about inundation at high-tide — that’s when you want the satellite to capture the picture,” says Yellen.
Once the team knew what type of satellite images were the most reliable, they could find the specific ones focused on the Northeastern coast and use them to generate the most accurate estimate yet of just how much blue carbon these marshes have stored and are continuing to store.
“Salt marshes alone can’t account for all the carbon that we’re currently releasing into the atmosphere,” says Yellen, “but if we are going to achieve carbon neutrality in the future, salt marshes can help offset the hardest parts of the economy to decarbonize. We just need to be sure that we protect them in the meantime.”
“These salt marshes are crucially important ecosystems for all sorts of reasons,” says Teng. “Now we know that they’re rich not only in terms of biodiversity, but also in terms of helping the planet to weather the worst of climate change.”
***
EGCS professor Jon Woodruff and Bonnie Turek, who contributed to this research as part of her graduate work at UMass Amherst, are also coauthors. This research was supported by the U.S. Department of Agriculture, the Natural Resources Conservation Service, U.S. Geological Society and the Department of the Interior’s Northeast Climate Adaptation Science Center.
Journal Reference:
Teng, W., Yu, Q., Yellen, B., Turek, B., & Woodruff, J. D., ‘Blue carbon mapping using temporally optimized satellite remote sensing imagery: A regional study of Northeast US salt marshes’, Journal of Geophysical Research: Biogeosciences 130, e2024JG008254 (2025). DOI: 10.1029/2024JG008254
Article Source:
Press Release/Material by University of Massachusetts Amherst
The ‘hydrogen economy’ may be relatively small, but critical
An international team of researchers led by Prof. Bob van der Zwaan of the University of Amsterdam and TNO Energy and Materials Transition have quantified the role of the ‘hydrogen economy’ in making our society more sustainable. In a paper published in Nature Communications, they present the results of extensive modelling of pathways to decarbonizing the European economy by 2050.
They conclude that when it comes to providing a sustainable primary source of energy, electrification will prove to be the most cost-efficient route for most economic sectors with an average total share of around 60% in final energy consumption. In contrast, the projected share of direct hydrogen use will be 10% at the highest.
In the public and scientific debate, the ‘hydrogen economy’ is at times presented as the ultimate solution to mitigating climate change. According to Prof. Van der Zwaan, this notion is both over-sold and under-appreciated:
“Our research shows that it will most likely be renewable-based electrification that offers the most cost-efficient decarbonization route for most sectors of the economy. We substantiate and quantify, for the first time, the role of direct hydrogen use as an alternative clean fuel. With just 6 to 10%, this projected share is relatively small. However, we do see a critical role for hydrogen in specific decarbonization pathways, in particular for heavy industry and transportation.”

Modelling challenges
The research led by Van der Zwaan is part of a multi-institution collaborative research project led by the KTH Royal Institute of Technology in Stockholm, Sweden. Called the European Climate and Energy Modelling Forum (ECEMF), it aims to establish a coherent and unified evidence base for policy development in reducing CO2 emissions. Central to the project is the comparison of model outcomes and strengthening the European modelling community.
For the research, eight well-established energy system models were combined to assess a set of pathways towards realizing net-zero CO2 emissions in Europe in the first half of the 21st century.
The models combine technical and economic aspects to arrive at feasible projections for technology implementation. According to Van der Zwaan, one of the challenges concerning the energy transition is so-called ‘sector coupling’.
“We used to model economic sectors more or less independently,” he says, “but now we see an interdependence developing between previously very different sectors. Take, for example, the residential sector – buildings, apartments, houses – and the transportation sector. With the huge amount of solar panels on rooftops, and people charging their electric cars at home, those sectors are becoming more and more interconnected. Similarly, the electricity sector and industry will become increasingly intertwined. We have to model all of that if we want to make valid projections.”
Final energy consumption
The results now published concern ‘final energy consumption’, where for instance renewable electricity is directly used or stored in the batteries of cars, and hydrogen is used as a clean, sustainable fuel. Focusing on this aspect, the researchers arrive at the predicted 6-10% share for hydrogen. Van der Zwaan acknowledges this is only a part of the potential hydrogen economy:
“Indeed, in future modelling we will also include the intermediary, enabling role of hydrogen for many sustainability transitions. Think of the production of synthetic kerosene to make air travel fossil-free. Or making the chemical industry more sustainable. And hydrogen can be a buffer to address the intermittency of renewable electricity generation.”
In a rough estimate, he expects that including such uses could well bring the share of the hydrogen economy to twice the level currently projected. To establish that figure with more accuracy and certainty, the ECEMF researchers will continue working on their models. “We really have to push the boundaries there, as we are working at the limits of our knowledge.”
Continued development of the hydrogen economy
Van der Zwaan underpins that even though the hydrogen economy might not become the future all-important sustainability driver, society really needs to continue its development. “I already mentioned a few crucial applications where hydrogen could become indispensable. It therefore will be imperative to gather all relevant insights needed to realize large-scale production, storage and use of hydrogen and gain the much-needed practical experience. We have to make sure that hydrogen can actually play the important role that we as energy system modelers currently see for hydrogen – a role that may seem relatively limited, but is likely to be fundamental.”
Journal Reference:
van der Zwaan, B., Fattahi, A., Dalla Longa, F. et al., ‘Electricity- and hydrogen-driven energy system sector-coupling in net-zero CO2 emission pathways’, Nature Communications 16, 1368 (2025). DOI: 10.1038/s41467-025-56365-0
Article Source:
Press Release/Material by University of Amsterdam (UvA)
U.S. stream network is longer during annual high-flow conditions
Rivers and streams may look permanent, but their lengths can change dramatically with the seasons, according to a new study.
It reports that stream networks in the United States expand up to five times their low-flow size during wet conditions. The findings offer the first large-scale insights into how water dynamically moves through landscapes and provide a framework for forecasting climate-driven changes in stream networks, particularly in response to increasing storminess. Traditionally regarded as static landscape features, stream networks exhibit significant seasonal and storm-driven fluctuations in their total wetted length.
For example, seasonal rainfall and snowmelt saturate the landscape, temporarily increasing streamflow and extending stream networks. Additionally, changes in surface topography and permeability can cause networks to expand or contract. This responsiveness of stream length to shifts in landscape wetness is termed “network elasticity.”
Alongside variations in wetness, it governs fluctuations in stream extent across drainage basins that influence sediment transport, nutrient cycling, gas exchange, and aquatic habitats. However, understanding stream network length variability has generally been limited to small-scale studies relying on field measurements – and to a handful of small drainage basins.
Here, Jeff Prancevic and colleagues used a semimechanistic model to estimate stream network elasticity for 14,765 basins across the contiguous U.S. Prancevic et al. found that the median stream network is five times longer during annual high-flow conditions than during low-flow conditions, with regional differences influenced by hydroclimate and topographic sensitivity.
Mountainous and humid regions tend to have more stable stream networks. The findings suggest that a basin’s topography and subsurface structure, which determine its network elasticity, are as crucial as climate factors in predicting fluctuations in stream length. Although the study focuses on the continental U.S., the authors note that the methodology, which only requires digital elevation models and streamflow data, could be applied more broadly.
Journal Reference:
Jeff P. Prancevic, Hansjörg Seybold and James W. Kirchner, ‘Variability of flowing stream network length across the US’, Science 387, 782-786(2025). DOI: 10.1126/science.ado2860
Article Source:
Press Release/Material by Walter Beckwith | American Association for the Advancement of Science (AAAS)
Featured image credit: Gerd Altmann | Pixabay


