In 1887, Groundhog Day began with a whimsical attempt to predict spring’s arrival using a rodent’s shadow, but scientific forecasting of seasonal changes has struggled to advance much beyond folklore.
Now, thanks to a rediscovered 19th-century phenology dataset – the earliest of its kind in the United States – researchers have transformed the science of predicting plant growth cycles.
Published in Communications Earth & Environment, their study enhances traditional methods with a novel factor: the rate at which springtime warming occurs. This advancement reveals how climate change has shifted the timing of flowering and leaf production for U.S. plant species by three to four weeks over the past 150 years.

Jerald Pinson | Florida Museum of Natural History (USA) – On February 2, 1887, residents of Punxsutawney Pennsylvania consulted a large rodent regarding the arrival of spring, marking the first official celebration of Groundhog Day.
According to Rob Guralnick, curator of biodiversity informatics at the Florida Museum of Natural History, our ability to predict the timing of seasons hasn’t improved much since then.
“We can’t generate good forecasts for whether spring will arrive early or late next year nearly as well as we can make predictions about the weather,” he said.
Weather patterns influence when a season begins and ends, but the ways in which plants and animals respond to these patterns, called phenology, is just as crucial. Meteorologists can make reliable temperature forecasts months in advance, but when it comes to predicting when a species of tree will start growing leaves throughout its range, scientists are often left shrugging.
When complex factors like climate change are added to the mix, such predictions become even more difficult to make.
But a new study is set to make seasonal forecasting a little less onerous and a lot more reliable. The authors enhanced existing approaches used to predict phenology and added a measurement of how fast an area warms in spring. This improvement allowed the authors to predict how the timing of leaf and flower production would change over a period spanning more than 150 years.
Plant species in the U.S. are flowering three to four weeks earlier than they did 150 years ago

The breakthrough was sparked by the rediscovery of an old 19th-century report containing thousands of detailed phenological observations for plants and animals throughout the eastern United States. The observations represent the earliest effort organized under the Smithsonian Institution to monitor biological cycles in the United states with volunteer collections, making it the first phenology-based citizen science project in the country.
Using these historical growth patterns as a starting point, the authors tested the accuracy of their equations. Given that plants produced leaves and flowers at a certain time in the 1850s, they predicted how the timing of those patterns would have changed 17 years later. They compared their results with modern observations to see how well they matched up.
Theresa Crimmins, the director of the USA National Phenology Network and co-author of the study, happened across the report while working on a book chapter about phenology. “I dug up this old document and realized there was actual data in it. Most of the other reports that had been referenced were just summaries.”
The report was the result of a short-lived citizen science network established by the Smithsonian Institution to monitor seasonal conditions and was published in two volumes by the U.S. Patent Office. The production of volume two, which contains the data on plants and animals – was significantly delayed due to a flurry of official documents that needed to be printed during the Civil War. When it finally made its way into print, the second half of the report contained information on when dozens of plants produced leaves, flowers and fruit from Michigan to Florida and as far west as California.
“This is the oldest dataset we have where we’re looking at broad-scale phenology, and the change between then and now is striking,” Guralnick said.
To test their equations, the authors began by comparing the historical growth cycles with observations made within the last decade for 18 plant species. They anticipated differences between the two time periods caused by climate change, but they were unprepared for the magnitude of how much had been altered.
“All 18 species advanced their leaf growth and flowering phenology,” Crimmins said. “On average, it’s occurring more than three weeks earlier than it did in the past. There are some species that are flowering more than a month earlier.”
The fact that global warming has resulted in earlier springs and longer summers is well-established, but owing to the lack of historical data, it’s rare to obtain confirmation that spans such a large breadth of time.
Rate of springtime warming influences when plants produce leaves and flowers
Not all areas – or all species – in the eastern U.S. have experienced the same rate of change over 175 years. Phenology in the northeastern U.S. has, for example, advanced to a greater degree than in the Southeast. The well-worn equations that have been used to predict leaf growth and flowering time have been unable to account for this and other seemingly anomalous patterns.
Normally, scientists use two broad variables to predict phenology: where the plant is located and how much warm weather it needs to become active. This tends to work well for individual species in a limited area, but it’s less effective at predicting broad changes, like the arrival of spring for an entire forest.
This limitation is generally attributed to large amounts of variation within and between species.
A maple tree will respond differently than an oak, for example, and an oak in one area will respond differently than an individual of the same species in another. Climate change throws another curve ball.
“Not only is there variation across species, there’s variation across latitudes in the rate of global warming. Climate is warming faster at higher latitudes,” said co-author Lindsay Campbell, an assistant professor at the University of Florida’s Florida Medical Entomology Laboratory.
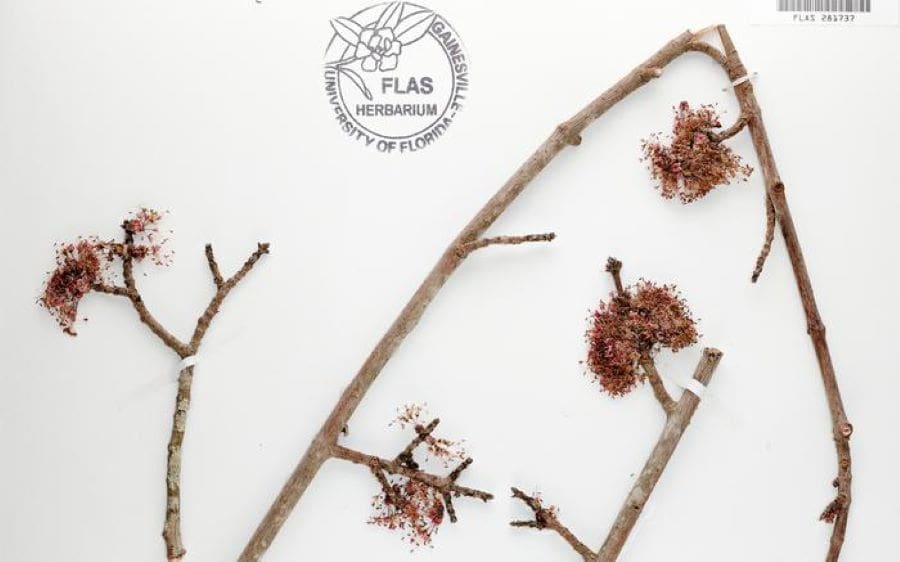
But even when scientists account for this unequal warming, there are other patterns that have so far eluded explanation. Red maples, for example, are among the earliest active plants in eastern North America. In late winter and early spring, leafless maples send out numerous crimson flowers that stand out among other bare and dormant trees like a signal flare.
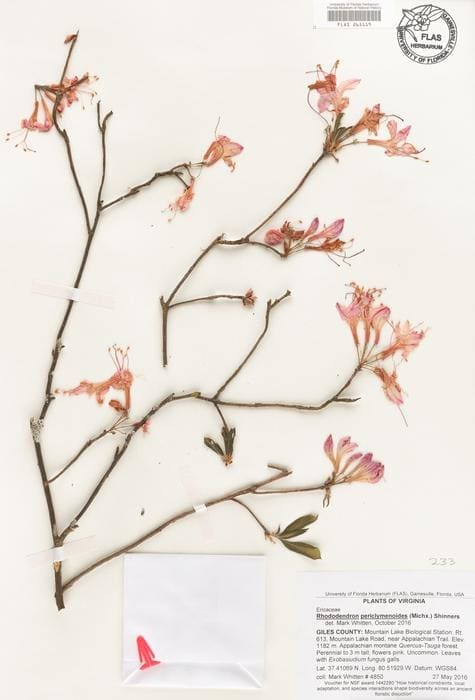
Pink azaleas take a more measured approach, with leaves and flowers arriving later in the season, towards mid-Spring. But in some conditions, this sequence can be reversed, and what are generally considered to be later-flowering plants – such as pink azaleas – can bear flowers before those considered to be early bloomers – like maples – that grow at the same latitude.
Guralnick suspected there was a missing piece of the puzzle that, if found, would help make sense of the patterns. In addition to a plant’s location and warmth requirements, he added a measurement for warming velocity, the rate at which heat is ratcheted up during spring. Areas next to large bodies of water tend to have slow warming velocities, because water takes longer to heat than air. Since water also retains warmth longer than air, these areas also tend to have warmer winters. He drew some back-of-the-napkin sketches and sought help from Crimmins and Campbell to refine the idea and develop a model for how warming velocity along with warm requirements might both determine phenology.
To test the idea, two museum interns, Michaela Keys and Carolyn Davis, digitized the historical data from the Smithsonian report. Co-author Erin Grady, a graduate student in the UF department of biology, compiled modern observations taken by citizen scientists that are publicly available through iNaturalist and the National Phenology Network.
After running the numbers, their intuition was confirmed. With the addition of warming velocity, their predictions accurately aligned with the patterns in their data.
It also provided an explanation for the patterns that until then had proven intractable, such as later-flowering plants outpacing early bloomers. Though they generally flower late, a pink azalea in an area where spring temperatures increase rapidly can end up producing flowers before a maple growing in an area where temperatures climb more slowly.
The increased accuracy at predicting cycles within ecosystems may give conservationists a leg up when it comes to planning ahead. As global temperatures continue to increase due to climate change, species are not only changing up when they do things, but they’re also doing them in different places as their distributions shift, Guralnick said.
“I’ve always been skeptical about whether we’ll be able to predict what the world will look like in the near future, but I think we’re getting better at it as we take a more holistic view and as we get the underlying processes nailed down. Doing so helps us manage the diversity we have left.”
Journal Reference:
Guralnick, R., Crimmins, T., Grady, E., Campbell, L., ‘Phenological response to climatic change depends on spring warming velocity’, Communications Earth & Environment 5, 634 (2024). DOI: 10.1038/s43247-024-01807-8
Article Source:
Press Release/Material by Florida Museum of Natural History
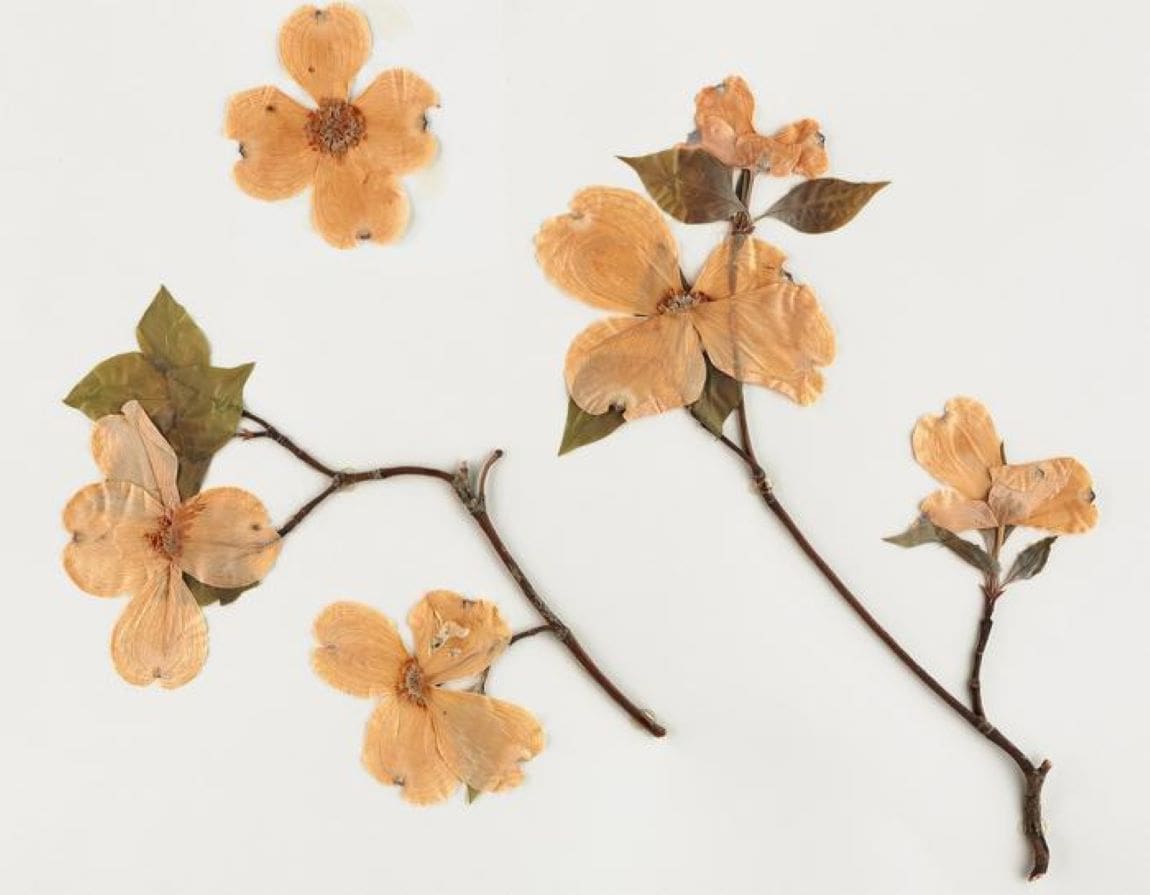
Featured image: A new study shows it’s possible for researchers to predict plant growth cycles, like leaf production and flowering time, with much more accuracy than ever before. The authors say this will be a critical tool for anticipating and mitigating the effects of global climate change. Credit: Florida Museum of Natural History | CC BY


