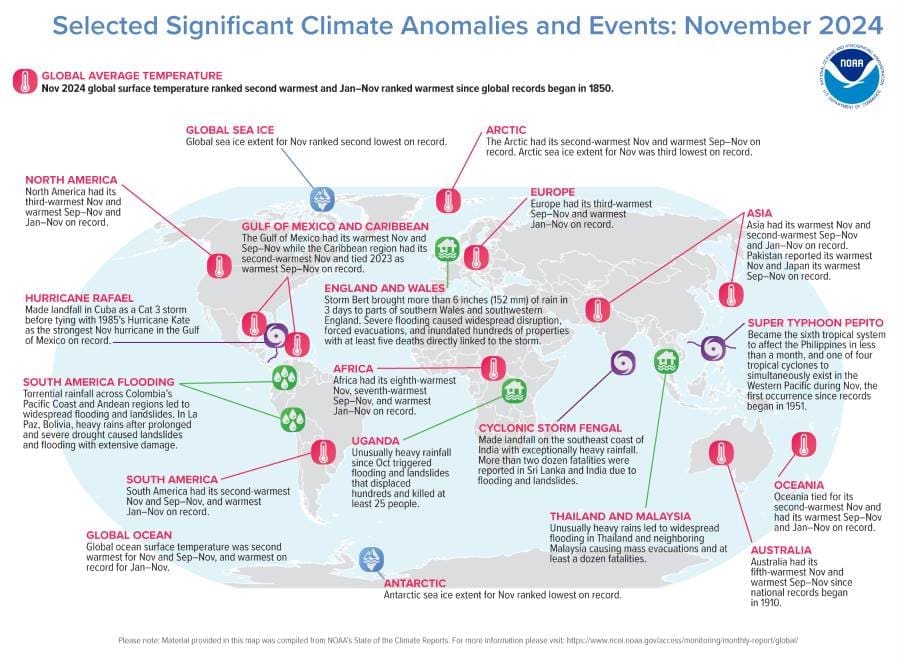
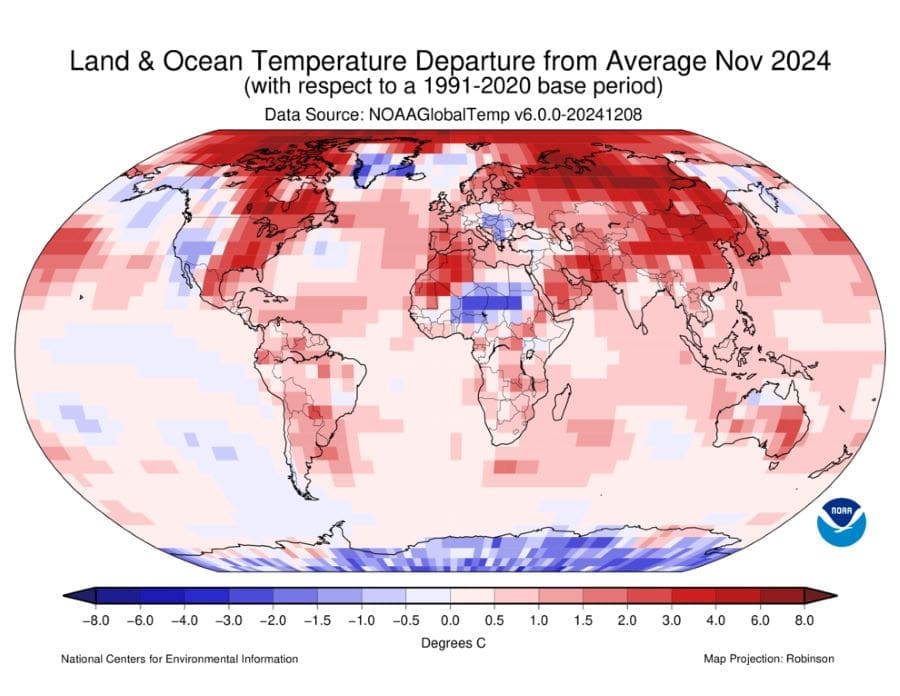
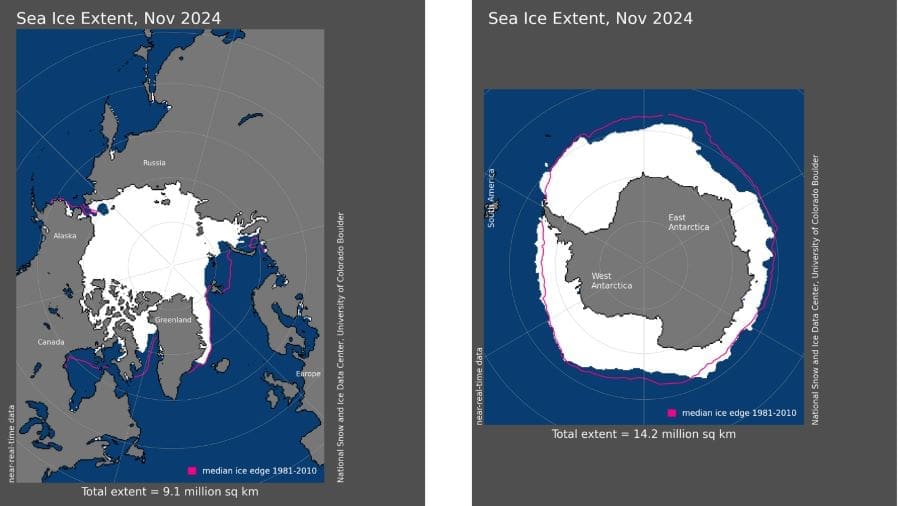
November 2024 marked the second-warmest November globally since records began, continuing a year characterized by extraordinary climate extremes. The month also witnessed the second-lowest global sea ice extent on record, further emphasizing the rapid pace of climate change.

Global temperature trends
Temperatures in November were significantly above average across large swathes of the globe, with Asia experiencing its warmest November on record. South America and Oceania recorded their second-warmest Novembers, while North America had its third warmest. Approximately 11% of the Earth’s surface registered record-high November temperatures, the largest extent for the month since 1951.
In Asia, heat extremes were particularly pronounced. Pakistan experienced its warmest November ever, with temperatures 2.89°C above the 1991–2020 average. India reported its third-warmest November, with Northwest India setting a new record. Japan and Hong Kong also ranked among their warmest Novembers on record. In Europe, countries like Switzerland, Estonia, and Norway reported significantly warmer-than-average conditions, underscoring a continent-wide warming trend.
In the Americas, the contiguous United States recorded its sixth-warmest November, and the Caribbean Islands region saw its second-warmest. The Gulf of Mexico shattered previous records, becoming the warmest on record for November. Similar records emerged in South America, where above-average temperatures spanned from northern Argentina to Brazil.

Global ocean temperatures mirrored these trends. Record-warm sea surface temperatures appeared in the tropical Atlantic, parts of the Indian Ocean, and the western Pacific, covering 11.1% of the world’s oceans—another historic high for November.
Precipitation extremes
Precipitation patterns were equally varied, with record rainfall in some areas and severe drought in others. In East Africa, heavy rains caused significant flooding in Uganda and the Democratic Republic of Congo. In contrast, northern India recorded its driest November in decades.
South America experienced both extremes. Bolivia’s western regions transitioned abruptly from drought to record rainfall, causing landslides and flooding. Colombia faced devastating floods in coastal and northern areas, with homes and infrastructure damaged. Meanwhile, Brazil’s northern regions endured persistent drought.
In Europe, November was drier than average overall, though areas of Scandinavia and western Russia experienced record wet conditions. The UK faced localized flooding after Storm Bert, which delivered intense rainfall over three days.
In Hong Kong, three tropical cyclones in November – a rare occurrence since 1946 – brought torrential rains. Monthly rainfall reached nearly five times the November average, marking the second-wettest November in its history.
Sea ice and snow cover
November also saw notable declines in sea ice and snow cover. The global sea ice extent was the second-lowest ever recorded for the month. In the Northern Hemisphere, snow cover was slightly below average, reflecting ongoing shifts in seasonal patterns.

Global cyclone activity
Tropical cyclone activity tied a long-term record in November, with 12 named storms worldwide. In the Atlantic Basin, three tropical cyclones contributed to this activity, including Hurricane Rafael, which peaked as a Category 3.
2024: A record-breaking year
Year-to-date global temperatures for 2024 now rank as the highest on record, with several continents – including Asia and South America – leading in regional rankings. The use of NOAA’s updated Global Surface Temperature dataset (NOAAGlobalTemp version 6.0.0) has improved temperature analyses, reinforcing the observed trends of a warming planet.
With climate records being broken more frequently, the data emphasizes the growing need for effective global strategies to address these ongoing and intensifying changes.
Source: NOAA National Centers for Environmental Information
Featured image credit: Freepik


