Floods, insufficient water, sinking river deltas: hydrologists map changing river landscapes across the globe
University of Massachusetts Amherst – A new study published in Science by researchers from the University of Massachusetts Amherst and University of Cincinnati has mapped 35 years of river changes on a global scale for the first time.
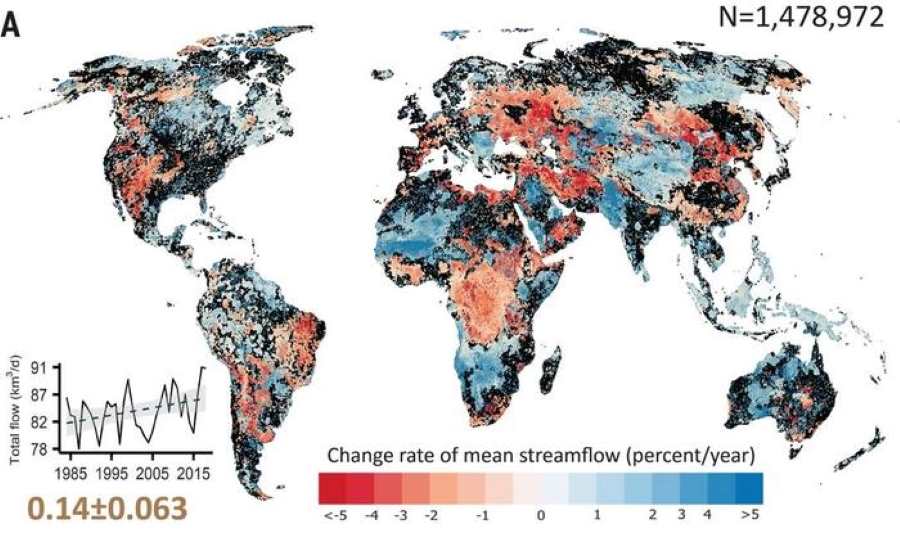
The work has revealed that 44% of the largest, downstream rivers saw a decrease in how much water flows through them every year, while 17% of the smallest upstream rivers saw increases. These changes have implications for flooding, ecosystem disruption, hydropower development interference and insufficient freshwater supplies.
Previous attempts to quantify changes in rivers over time have only looked at specific outlet reaches or a rear basin part of a river, explains Dongmei Feng, lead author, assistant professor at the University of Cincinnati and former research assistant professor in the Fluvial@UMass lab run by the paper’s co-author Colin Gleason, Armstrong Professional Development Professor of civil and environmental engineering at UMass Amherst.
“But as we know, rivers are not isolated,” she says. “So even if we are interested in one location, we have to think about how it’s impacted both upstream and downstream. We think about the river system as a whole, organically connected system. The takeaway from this paper is: The rivers respond to factors- climate change or human regulation – differently [and] we provide the finer detail of those responses.”
River flow rate, also known as discharge, describes how much water flows through a river, measured in cubic meters per second or gallons per day. Currently, flow rate is measured by manually dragging a tool (called an acoustic doppler current profiler) across the surface of a river and then combining it with another automatic measurement of river depth to calculate flow rate over time. Because this approach and only measures flow rate at a specific location, at a specific time, data on flow rates are extremely limited.
“There are about 10-15,000 infinitesimally small slices around the world where we know river discharge – that’s it – out of millions and millions of miles of rivers,” says Gleason.
So Feng and Gleason developed a new approach using satellite data and computer modeling to capture this flow rate across 3 million stream reaches worldwide. “That’s every river, every day, everywhere, over a 35-year period,” Gleason says. “Some of these are changing by 5 or 10% per year. That’s rapid, rapid change. We had no idea what those flow rates were or how they were changing – which rivers are not like they used to be – now we know.”
The significant decreases found in downstream rivers mean that less fresh water is available on the largest parts of many rivers worldwide. This has significant impacts on drinking water and irrigation.
“Communities that use river water for irrigation and drinking water, if that’s dropping, then is there a sustainable use?” says Gleason. “Can you grow your town? Can you grow your city? Can you increase your number of [acres] in production? Can the river support it? We don’t know exactly why [this is happening], but we do know that’s what it might mean.”
The decrease in flow rate also means that the river has less power to move dirt and small rocks in the river bed. The movement of this sediment downstream builds deltas and is an important process in countering sea rise, so this loss of power is detrimental to deltas, especially in light of modern dam building limiting how much sediment is available to move.
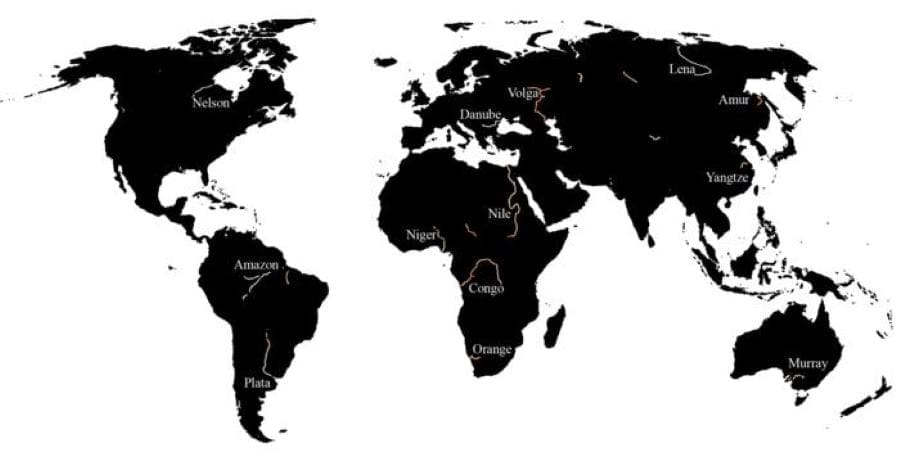
Smaller, upstream rivers (typically closer to mountains) are showing an inverse pattern: 17% are seeing an increase in flow. (Though, Gleason points out, this is not uniform, as 10% are decreasing.) This increase in volume in these small rivers can have big impacts on their surrounding communities. The researchers found a 42% increase in large floods of these small streams. Gleason cites those that have occurred in Vermont in recent summers as an example.
“Floods are disastrous for humans, but for upstream species, they may be advantageous,” adds Feng. Flooding provides important nutrients and a means of travel for migrating fish. “The local people [near the western Amazon River], for example, have reported that the fish migration has increased in that region because the flooding is more frequent, which means the high flow required for fish migration is more frequent.”
This increase in upstream flow rate may also throw an unexpected wrench in hydropower plans, particularly in High Mountain Asia for places like Nepal and Bhutan. “The increased flow of the river channel means erosion power is much more significant than before and it’s transporting more sediment downstream,” says Feng. This becomes an issue for countries looking to develop more clean energy because this sediment can clog up hydropower plants.
While the paper cannot quantify the exact cause and effect, the researchers know that the general drivers of these changes are largely climate change and human activity.
“Upstream river regions have increasing precipitation in general,” says Feng. “And the snow melt in the high elevation, which is typically cold, is probably more sensitive to climate change, so the snow melt has been increasing in these regions.” Human activity includes sourcing water from rivers for drinking or agriculture or wastewater dumping.
And Gleason adds that this paper is an important step: “If you don’t know what it is, you can’t figure out why it is. People who live along these rivers, of course, know there are problems, but if you’re a policy analyst and you’re trying to determine the best location for a new hydropower plant out of 100 candidates, it’s hard to measure 100 different rivers accurately. [Colleagues in water systems say] you would be shocked at how many places, particularly those that are resource-limited, make major decisions about climate futures, water resources, and infrastructure projects with almost no data on hand. My hope is that everyone can use these data, understand them, and maybe make a more informed decision.”
Journal Reference:
Dongmei Feng, Colin J. Gleason, ‘More flow upstream and less flow downstream: The changing form and function of global rivers’, Science 386, 1305-1311 (2024). DOI:10.1126/science.adl5728
Article Source:
Press Release/Material by University of Massachusetts Amherst
Surveys show full scale of massive die-off of common murres following the ‘warm blob’ in the Pacific Ocean
Hannah Hickey | University of Washington – Murres, a common seabird, look a little like flying penguins. These stout, tuxedo-styled birds dive and swim in the ocean to eat small fish and then fly back to islands or coastal cliffs where they nest in large colonies. But their hardy physiques disguise how vulnerable these birds are to changing ocean conditions.
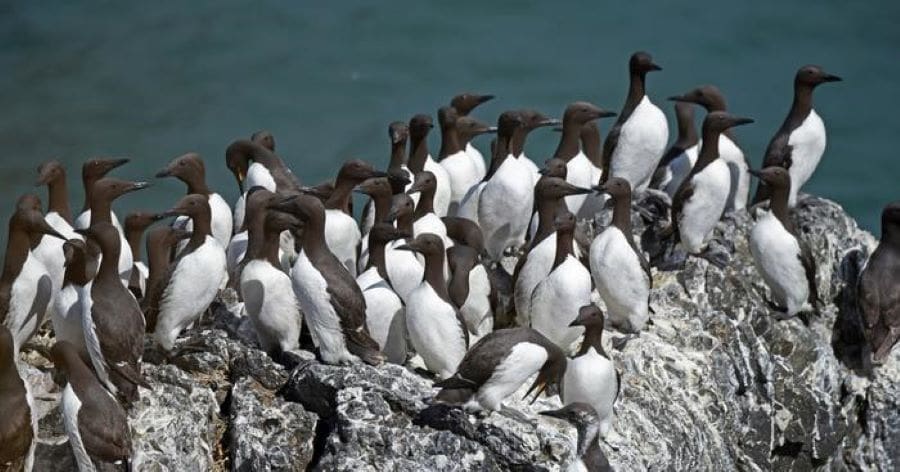
A University of Washington citizen science program – which trains coastal residents to search local beaches and document dead birds – has contributed to a new study, led by federal scientists, documenting the devastating effect of warming waters on common murres in Alaska.
In 2020, participants of the UW-led Coastal Observation and Seabird Survey Team (COASST), and other observers first identified the massive mortality event affecting common murres along the West Coast and Alaska. That study documented 62,000 carcasses, mostly in Alaska, in one year. In some places, beachings were more than 1,000 times normal rates. But the 2020 study did not estimate the total size of the die-off after the 2014-16 marine heat wave known as “the blob.”
In this new paper, published in Science, a team led by the U.S. Fish and Wildlife Service analyzed years of colony-based surveys to estimate total mortality and later impacts. The analysis of 13 colonies surveyed between 2008 and 2022 finds that colony size in the Gulf of Alaska, east of the Alaska Peninsula, dropped by half after the marine heat wave. In colonies along the eastern Bering Sea, west of the peninsula, the decline was even steeper, at 75% loss.
The study led by Heather Renner, a wildlife biologist at the U.S. Fish and Wildlife Service, estimates that 4 million Alaska common murres died in total, about half the total population. No recovery has yet been seen, the authors write.
“This study shows clear and surprisingly long-lasting impacts of a marine heat wave on a top marine predator species,” said Julia Parrish, a UW professor of aquatic and fishery sciences and of biology, who was a co-author on both the 2020 paper and the new study. “Importantly, the effect of the heat wave wasn’t via thermal stress on the birds, but rather shifts in the food web leaving murres suddenly and fatally without enough food.”
The “warm blob” was an unusually warm and long-lasting patch of surface water in the northeast Pacific Ocean from late 2014 through 2016, affecting weather and coastal marine ecosystems from California to Alaska. As ocean productivity decreased, it affected food supply for top predators including seabirds, marine mammals and commercially important fish. Based on the condition of the murre carcasses, authors of the 2020 study concluded that the most likely cause of the mass mortality event was starvation.
Before this marine heat wave, about a quarter of the world’s population, or about 8 million common murres, lived in Alaska. Authors estimate the population is now about half that size. While common murre populations have fluctuated before, the authors note the Alaska population has not recovered from this event like it did after previous, smaller die-offs.
While the “warm blob” appears to have been the most intense marine heat wave yet, persistent, warm conditions are becoming more common under climate change. A 2023 study led by the UW, including many of the same authors, showed that a 1 degree Celsius increase in sea surface temperature for more than six months results in multiple seabird mass mortality events.

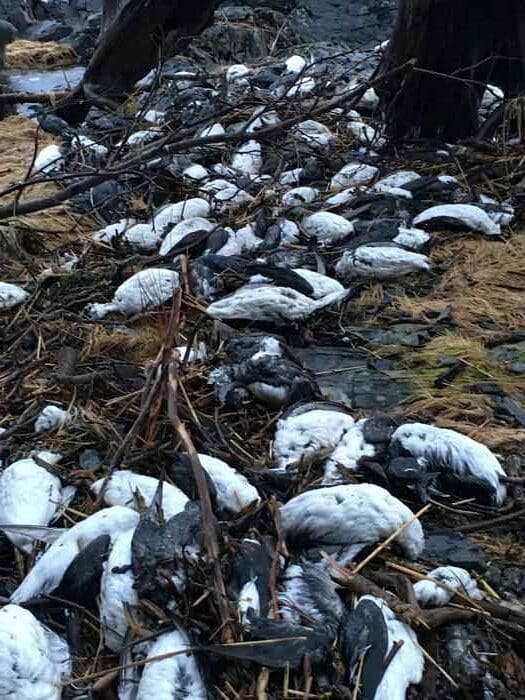
“Whether the warming comes from a heat wave, El Niño, Arctic sea ice loss or other forces, the message is clear: Warmer water means massive ecosystem change and widespread impacts on seabirds,” Parrish said.
“The frequency and intensity of marine bird mortality events is ticking up in lockstep with ocean warming,” Parrish said.
The 2023 paper suggested seabird populations would take at least three years to recover after a marine heat wave. The fact that common murres in Alaska haven’t recovered even seven years after “the blob” is worrisome, Parrish said.
“We may now be at a tipping point of ecosystem rearrangement where recovery back to pre-die-off abundance is not possible.”
Other co-authors are Brie Drummond and Jared Laufenberg at the U.S. Fish and Wildlife Service offices in Alaska; John Piatt, a former federal scientist now with the World Puffin Congress in Port Townsend; and Martin Renner at Tern Again Consulting in Homer.
Journal Reference:
Heather M. Renner et al. ‘Catastrophic and persistent loss of common murres after a marine heatwave’, Science 386, 1272-1276 (2024). DOI: 10.1126/science.adq4330
Article Source:
Press Release/Material by University of Washington
El Niño exacerbates effects of drought on Amazon groundwater and increases fire risk, study finds
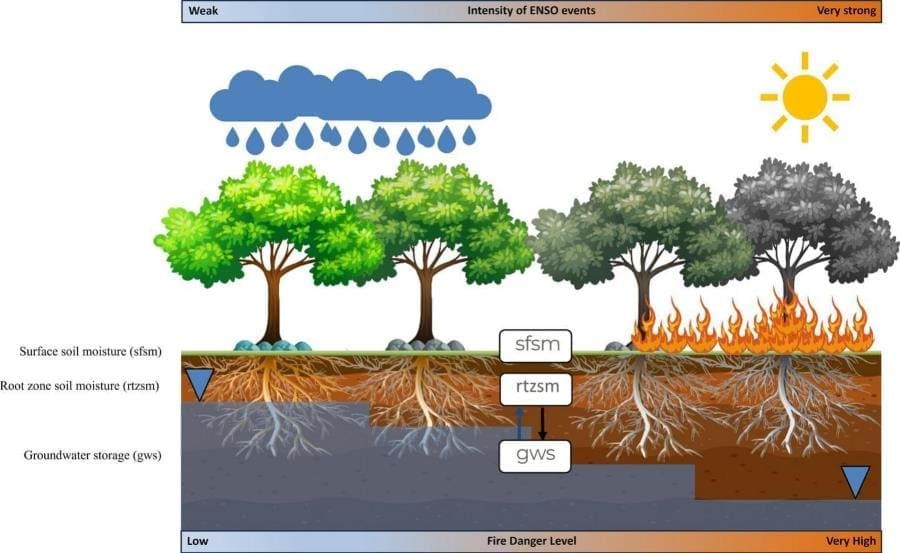
Luciana Constantino | Agência FAPESP – The risk of fires in the Amazon is greater in regions where groundwater storage is compromised, especially when El Niño exacerbates the drought. Using satellite images and data from fires, researchers have been able to demonstrate the relationship between the climatic phenomenon and the propensity for fires, creating a tool that could help with future prevention efforts.
The results of the study, based on information from 2004 to 2016, show a decrease in moisture conditions at three levels – topsoil (SFSM), tree root zone (RTZSM) and groundwater (GWS), with the latter being the most arid. It is these “reservoirs” that take the longest to recover when they are affected by successive and extreme droughts caused by El Niño, one of the climatic phenomena with the greatest impact on Earth.
In recent decades, human-caused (anthropogenic) forest fires have significantly altered the dynamics of vegetation in the Amazon region. These human activities are considered “ignitions” for fire in the rainforest, and the escalation of fires is linked to climatic conditions.
This year alone, the total number of fires recorded in the Brazilian Amazon from January to November 20th is the highest since 2010 – 132,211 in just under 11 months, according to data from Brazil’s National Institute of Space Research (INPE). Using a different methodology to that of INPE, the Laboratory of Environmental Satellite Applications (LASA) of the Federal University of Rio de Janeiro (UFRJ) points out that about 128,000 km² of the biome have already been burned this year, an area equivalent to the territory of England.
“We decided to investigate the impact of the meteorological and hydrological drought on fires in the Amazon, paying attention to the role of groundwater and El Niño events, as part of the SACRE project, which focuses more on urban areas, but also looks at rural areas and forests. And we’ve been able to demonstrate the relationship,” says Professor Bruno Conicelli of the Institute of Geosciences at the University of São Paulo (USP), corresponding author of the study.
The article, published in the journal Science of the Total Environment, was co-authored by researcher Ricardo Hirata, coordinator of “SACRE: Integrated Water Solutions for Resilient Cities”. One of the largest applied research projects on water resources in Brazil, SACRE focuses on groundwater and aims to reduce the vulnerability of cities and rural areas to crises related to global climate change. It is supported by FAPESP through a Thematic Project.
Database
To characterize the hydrological drought, the researchers used satellite data from the GRACE mission, which measures terrestrial water storage by integrating soil moisture, surface water, and groundwater.
They cross-referenced this with data on the severity of the drought in each of the locations studied. They were able to identify areas of lower humidity concentration in the northeast of the Amazon basin, as well as a decrease in humidity toward the east.
The largest areas burned coincided with regions that experienced drought during extreme El Niño events, with an increase between 2015 and 2016. At the time, the phenomenon was considered one of the three most intense on record (along with 1982/83 and 1997/98). According to the World Meteorological Organization (WMO), the 2023/2024 event ranks among the five strongest.
El Niño is characterized by an abnormal warming of the surface of the Pacific Ocean due to a decrease in the intensity of the trade winds. Atmospheric circulation patterns over the Pacific are altered, with a change in the distribution of humidity and temperatures in different parts of the planet. International reports indicate that the frequency and intensity of this event will increase in the coming decades.
“We know that fires in the Amazon have anthropogenic origins. However, when there’s a record of a more intense El Niño, as there was in 2016, which we investigated, and again in 2024, meteorological and hydrological droughts become more severe in the forest. Under these conditions, the vegetation depends heavily on groundwater to survive. The smaller trees, with shallower roots, are the first to suffer from the lack of water,” says Conicelli, who was the supervisor of the paper’s first author, Naomi Toledo. When the research began, she was a student at the IKIAM Amazon Regional University in Ecuador, where Conicelli was a professor for four years.
In August, an international group published the first State of Wildfires report, showing that fires in the western Amazon – which includes the Brazilian states of Amazonas, Acre, Roraima and Rondônia – between March 2023 and February 2024 were driven by prolonged droughts linked to El Niño. Combined with weather conditions, droughts explained 68% of these fires, followed by the influence of anthropogenic activities such as deforestation, agriculture and fragmentation of natural landscapes (read more at: agencia.fapesp.br/52662).
Alert system
Based on the results of the work, the group is developing a fire risk index adapted to the Amazon region, including both meteorological indicators (linked to rainfall) and hydrological indicators (water in the soil, rivers, aquifers and other reserves). The model can be applied to other ecosystems.
By demonstrating the link between meteorological and hydrological conditions and the aggravation of forest fires, the results can contribute to fire risk reduction and prevention strategies. “Studies like these are also important for raising awareness of how vulnerable the forest is to extreme weather events, which are increasingly frequent and intense,” adds the researcher.
In the future, Conicelli says, the system will be able to add data collected in the field to warn of declining groundwater levels.
Journal Reference:
Naomi Toledo, Gabriel Moulatlet, Gabriel Gaona, Bryan Valencia, Ricardo Hirata, Bruno Conicelli, ‘Dynamics of meteorological and hydrological drought: The impact of groundwater and El Niño events on forest fires in the Amazon’, Science of The Total Environment 954, 176612 (2024). DOI: 10.1016/j.scitotenv.2024.176612
Article Source:
Press Release/Material by Fundação de Amparo à Pesquisa do Estado de São Paulo (FAPESP)
Aldabra Atoll’s remarkable shoreline resilience over 51 years
University of Zurich – Low-lying islands are threatened by sea level rise due to global warming. Between 1993 and 2013, coastal areas within the Western Indian Ocean experienced a sea level rise of 2-3 mm per year. Understanding how this rise affects the shoreline of Aldabra Atoll, a UNESCO World Heritage Site in Seychelles, is crucial for the management and protection of its unique ecosystem and species.
Aldabra’s shoreline is dynamic but does not show major loss overall
A new study led by scientists from the University of Zurich and the Seychelles Islands Foundation has illuminated the dynamic yet stable nature of Aldabra Atoll’s shoreline. Recently published in Scientific Reports, this research tracked shoreline changes for 51 years using aerial and satellite images, providing the first comprehensive understanding of shoreline responses on raised atolls.
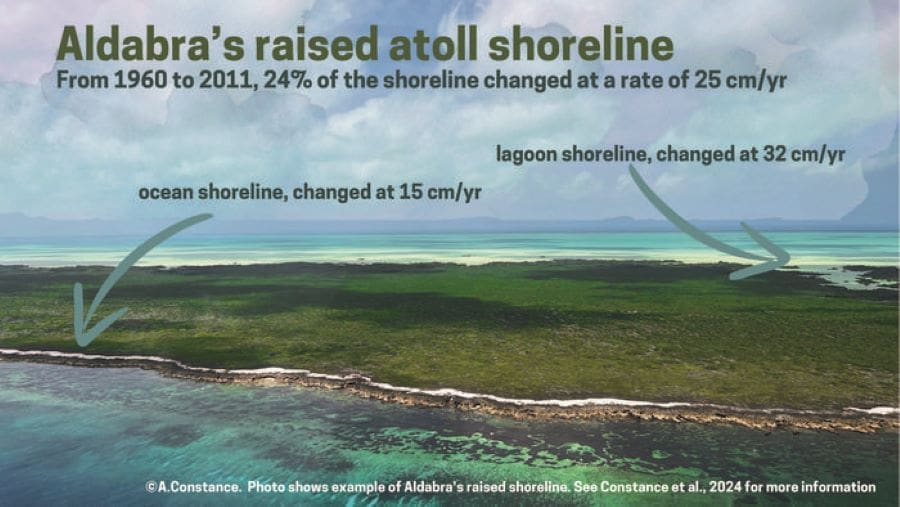
Despite rising sea levels and reduced sediment supply, Aldabra Atoll has successfully maintained its net shoreline and likely total land area. Findings show that 61% of the shoreline remained unchanged, while the areas that did change averaged approximately 25 cm per year – lower than the global average for atolls. The lagoon shoreline underwent more rapid changes than the erosion-resistant ocean shoreline, particularly in areas exposed to wind and waves.
Local shoreline changes and effects on ecosystems
While the shoreline on average, has not changed, the study observed local accretion and erosion affecting 24% of the total shoreline (12% of the shoreline accreted and 12% eroded). For example, accretion happened on the lagoon shoreline, shifting sandy beaches to mangrove habitats. On the other hand, erosion affected sandy beaches with turtle nesting sites and the research station.
Leaving islands and their surroundings undisturbed is importance for their resilience
Annabelle Constance from the Seychelles Islands Foundation, the lead author, stated: “Our findings are significant as they highlight Aldabra Atoll’s resilience and its ability to maintain its shoreline despite rising sea levels and climate change.”
She further emphasized: “Our research enhances understanding of reef island adjustment capacities in raised atolls and provides a benchmark for shoreline change rates for atolls, given the minimal human impact on Aldabra.”
However, continuous monitoring and timely adaptation strategies remain crucial for the conservation of Aldabra’s unique ecosystems, particularly as extreme events and the impacts of climate change are predicted to worsen.

“Translating our findings into a broader context highlights the importance of minimizing local human impacts on the coastline, particularly regarding sediment availability, to preserve the natural dynamics of reef islands,” she said.
“We were very lucky to have access to airborne imagery that was available from the 1960’s, providing a unique reference in time” says Gabriela Schaepman-Strub, professor at the University of Zurich. “But we should not forget – this imagery was acquired when Aldabra was threatened by development plans back then.” The plans were eventually stopped and Aldabra became a UNESCO World Heritage and Ramsar Wetland Site.
Schaepman-Strub adds: “And as we understand now from our study, the resilience of Aldabra’s shoreline to sea level rise might be tightly linked to its high protection status. If humans start to disturb this system, for example by building tourism infrastructure into the sea or on land, this might strongly impact the natural erosion and accretion mechanisms, reducing the resilience to sea level rise.”
Journal Reference:
Constance, A., Bunbury, N., Lack, N. et al. ‘Low average shoreline change rate in 51 years on the raised Aldabra Atoll’, Scientific Reports 14, 28970 (2024). DOI: 10.1038/s41598-024-74595-y
Article Source:
Press Release/Material by University of Zurich
Featured image credit: Gerd Altmann | Pixabay


