So you want to build a solar or wind farm? Here’s how to decide where
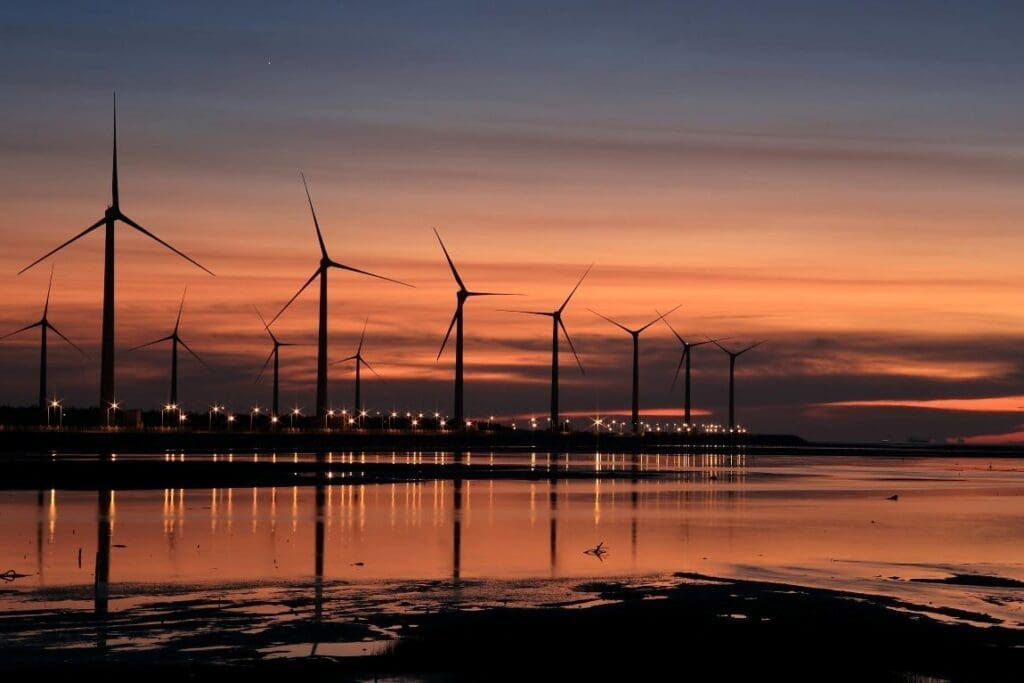
David L. Chandler | MIT News – Deciding where to build new solar or wind installations is often left up to individual developers or utilities, with limited overall coordination. But a new study shows that regional-level planning using fine-grained weather data, information about energy use, and energy system modeling can make a big difference in the design of such renewable power installations. This also leads to more efficient and economically viable operations.
The findings show the benefits of coordinating the siting of solar farms, wind farms, and storage systems, taking into account local and temporal variations in wind, sunlight, and energy demand to maximize the utilization of renewable resources. This approach can reduce the need for sizable investments in storage, and thus the total system cost, while maximizing availability of clean power when it’s needed, the researchers found.
The study, published in the journal Cell Reports Sustainability, was co-authored by Liying Qiu and Rahman Khorramfar, postdocs in MIT’s Department of Civil and Environmental Engineering, and professors Saurabh Amin and Michael Howland.

Qiu, the lead author, says that with the team’s new approach, “we can harness the resource complementarity, which means that renewable resources of different types, such as wind and solar, or different locations can compensate for each other in time and space. This potential for spatial complementarity to improve system design has not been emphasized and quantified in existing large-scale planning.”
Such complementarity will become ever more important as variable renewable energy sources account for a greater proportion of power entering the grid, she says. By coordinating the peaks and valleys of production and demand more smoothly, she says, “we are actually trying to use the natural variability itself to address the variability.”
Typically, in planning large-scale renewable energy installations, Qiu says, “some work on a country level, for example saying that 30 percent of energy should be wind and 20 percent solar. That’s very general.” For this study, the team looked at both weather data and energy system planning modeling on a scale of less than 10-kilometer (about 6-mile) resolution. “It’s a way of determining where should we exactly build each renewable energy plant, rather than just saying this city should have this many wind or solar farms,” she explains.
To compile their data and enable high-resolution planning, the researchers relied on a variety of sources that had not previously been integrated. They used high-resolution meteorological data from the National Renewable Energy Laboratory, which is publicly available at 2-kilometer resolution but rarely used in a planning model at such a fine scale.
These data were combined with an energy system model they developed to optimize siting at a sub-10-kilometer resolution. To get a sense of how the fine-scale data and model made a difference in different regions, they focused on three U.S. regions — New England, Texas, and California — analyzing up to 138,271 possible siting locations simultaneously for a single region.
By comparing the results of siting based on a typical method vs. their high-resolution approach, the team showed that “resource complementarity really helps us reduce the system cost by aligning renewable power generation with demand,” which should translate directly to real-world decision-making, Qiu says. “If an individual developer wants to build a wind or solar farm and just goes to where there is the most wind or solar resource on average, it may not necessarily guarantee the best fit into a decarbonized energy system.”
That’s because of the complex interactions between production and demand for electricity, as both vary hour by hour, and month by month as seasons change. “What we are trying to do is minimize the difference between the energy supply and demand rather than simply supplying as much renewable energy as possible,” Qiu says. “Sometimes your generation cannot be utilized by the system, while at other times, you don’t have enough to match the demand.”
In New England, for example, the new analysis shows there should be more wind farms in locations where there is a strong wind resource during the night, when solar energy is unavailable. Some locations tend to be windier at night, while others tend to have more wind during the day.
These insights were revealed through the integration of high-resolution weather data and energy system optimization used by the researchers. When planning with lower resolution weather data, which was generated at a 30-kilometer resolutionglobally and is more commonly used in energy system planning, there was much less complementarity among renewable power plants. Consequently, the total system cost was much higher. The complementarity between wind and solar farms was enhanced by the high-resolution modeling due to improved representation of renewable resource variability.
The researchers say their framework is very flexible and can be easily adapted to any region to account for the localgeophysical and other conditions. In Texas, for example, peak winds in the west occur in the morning, while along the south coast they occur in the afternoon, so the two naturally complement each other.
Khorramfar says that this work “highlights the importance of data-driven decision making in energy planning.” The work shows that using such high-resolution data coupled with carefully formulated energy planning model “can drive the system cost down, and ultimately offer more cost-effective pathways for energy transition.”
One thing that was surprising about the findings, says Amin, who is a principal investigator in the Laboratory of Information and Data Systems, is how significant the gains were from analyzing relatively short-term variations in inputs and outputs that take place in a 24-hour period. “The kind of cost-saving potential by trying to harness complemetarity within a day was not something that one would have expected before this study,” he says.
In addition, Amin says, it was also surprising how much this kind of modeling could reduce the need for storage as part of these energy systems. “This study shows that there is actually a hidden cost-saving potential in exploiting local patterns in weather, that can result in a monetary reduction in storage cost.”
The system-level analysis and planning suggested by this study, Howland says, “changes how we think about where we site renewable power plants and how we design those renewable plants, so that they maximally serve the energy grid. It has to go beyond just driving down the cost of energy of individual wind or solar farms. And these new insights can only be realized if we continue collaborating across traditional research boundaries, by integrating expertise in fluid dynamics, atmospheric science, and energy engineering.”
The research was supported by the MIT Climate and Sustainability Consortium and MIT Climate Grand Challenges.
Journal Reference:
Liying Qiu, Rahman Khorramfar, Saurabh Amin, Michael F. Howland, ‘Decarbonized energy system planning with high-resolution spatial representation of renewables lowers cost’, Cell Reports Sustainability (2024). DOI: 10.1016/j.crsus.2024.100263
Article Source: Press Release/Material | Massachusetts Institute of Technology
Scientists urged to pull the plug on ‘bathtub modeling’ of flood risk
University of California – Irvine – Recent decades have seen a rapid surge in damages and disruptions caused by flooding.
In a commentary article published in the American Geophysical Union journal Earth’s Future, researchers at the University of California, Irvine and the University of Bristol in the United Kingdom – the latter also executives of U.K. flood risk intelligence firm Fathom – call on scientists to more accurately model these risks and caution against overly dramatized reporting of future risks in the news media.
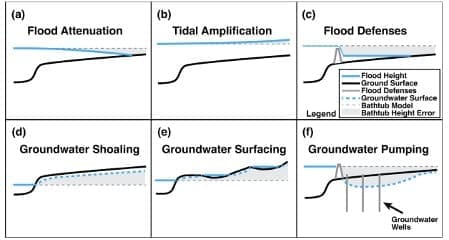
In the paper, the researchers urge the climate science community to turn away from an outdated approach to mapping flood hazards known as “bathtub modeling,” which is an assumption that floods spread out over areas as a level pool. The technique is often used as a straightforward way to visualize flood impact in coastal areas but, according to the authors, can lead to an oversimplified and less realistic picture of flood risk than more advanced methods. The alternative to bathtub modeling, they say, is dynamical modeling that solves physics-based equations.
“Bathtub models can both overpredict and underpredict flooding,” said co-author Brett Sanders, UC Irvine Chancellor’s Professor of civil & environmental engineering. “One of the biggest causes of error is that bathtub models fail to accurately account for the systems in place to protect people and assets, including storm drains, levees and pumping.”
He and his collaborators – Oliver Wing, chief scientific officer at Fathom and an honorary research fellow at the University of Bristol; and Paul Bates, a University of Bristol professor of hydrology and Fathom chairman – note that bathtub modeling is limited in its ability to account for at least six key factors.

Those are: flood attenuation from the effects of event dynamics and friction on flood spreading; tidal amplification associated with the resonance of ocean tides within coastal embayments; flood defenses such as levees and floodwalls that may overtop during an extreme event but still restrain the degree of inland flooding; shoaling of the groundwater table; surfacing groundwater from the combined influence of rising sea levels and changing hydrologic budgets; and pumping of groundwater within lands below sea level to mitigate inundation by rising groundwater.
Based on a review of literature pertaining to flood risk, the research team summarizes the reduced accuracy of bathtub models using the critical success index, which scores flood extent accuracy between 0 and 1, where 1 represents a perfect match based on field measurements. The CSI for bathtub models analyzed in the literature is consistently under 0.5, well below the threshold of 0.65 that experts suggest models need in order to have local relevance and therefore produce useful results when applied in impact analyses.
“CSIs under 0.5 indicate that these models are worse than a random classification,” Wing said. “In other words, a chimpanzee has more skill than a bathtub model in delineating flood hazard areas.”
Studies that rely on bathtub modeling are frequently found in short-format, high-impact journal publications and attract considerable interest from the news media, according to the researchers. While the biases and uncertainties of bathtub modeling are often acknowledged in these technical papers, the message communicated to the public and policymakers – sometimes with compelling visualizations of cities under water – is too often an exaggeration, they say.
“Accurate maps of areas at risk of flooding are of paramount importance for everyone from home and business owners to insurers, banks and governments,” Bates said. “We all have a role to play in reducing flood losses, but it all starts with trustworthy information.”
Reliable models of flood risk are needed to effectively engage impacted communities in adaptation processes and to implement effective and equitable mitigation and adaptation strategies, according to Sanders. Inaccurate models could lead to maladaptation.
“Projections of flooding need to make sense to people, not only for building understanding of what’s at risk but also for deciding upon the investments and policies that will be made to manage it,” Sanders said. “In fact, numerous research papers have shown that residents within at-risk areas are unlikely to trust projections of future flooding if they don’t reflect their lived experiences. Research studies that oversimplify flooding and don’t represent real-world data pose a threat to transformative action.”
Journal Reference:
Brett F. Sanders, Oliver E. J. Wing, Paul D. Bates, ‘Flooding is Not Like Filling a Bath’, Earth’s Future (2024). DOI: 10.1029/2024EF005164
Article Source: Press Release/Material | University of California – Irvine
Record-low Antarctic sea ice can be explained and forecast months out by patterns in winds
University of Washington – Amid all the changes in Earth’s climate, sea ice in the stormy Southern Ocean surrounding Antarctica was, for a long time, an odd exception. The maximum winter sea ice cover remained steady or even increased slightly from the late 1970s through 2015, despite rising global temperatures.
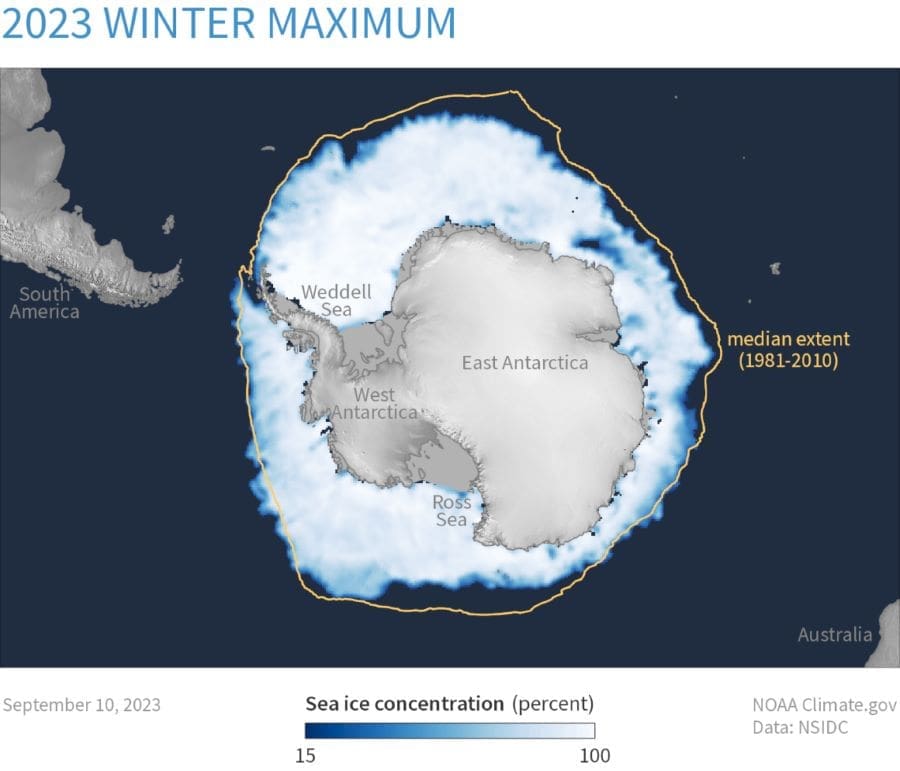
That began to change in 2016. Several years of decline led to an all-time record low in 2023, more than five standard deviations below the average from the satellite record. The area of sea ice was 2.2 million square kilometers below the average from the satellite record, a loss almost 12 times the size of Washington state. The most recent winter’s peak, recorded in September 2024, was very close to the previous year’s record low.
University of Washington researchers show that the all-time record low can be explained by warm Southern Ocean conditions and patterns in the winds that circled Antarctica months earlier, allowing forecasts for sea ice coverage around the South Pole to be generated six or more months in advance. This could support regional and global weather and climate models.
The open-access study was published in Nature Communications Earth & Environment.
“Since 2015, total Antarctic sea ice area has dramatically declined,” said lead author Zac Espinosa, a UW doctoral student in atmospheric and climate science. “State-of-the-art forecasting methods for sea ice generally struggle to produce reliable forecasts at such long leads. We show that winter Antarctic sea ice has significant predictability at six- to nine-month lead times.”

The authors used a global climate model to simulate how ocean and air temperatures, including longer-term cycles like El Niño and La Niña, affect sea ice in the Southern Ocean.
Results showed that the 2023 El Niño was less important than previously thought. Instead, an arching pattern of regional winds, and their effects on ocean temperatures up to six months in advance, could explain 70% of the 2023 record-low winter sea ice.
These winds cause ocean mixing in the Southern Ocean that can pull deeper warm water up to the surface, thus suppressing sea ice growth. Winds can also push sea ice poleward toward Antarctica to prevent the sea ice edge from expanding north, transport heat from lower latitudes toward the poles, and generate ocean waves that break up sea ice.
Using the same approach for the 2024 observations correctly predicted that this would be another low year for Southern Ocean sea ice cover.
“It’s interesting that, despite how unusual the winter sea ice conditions were in 2023 and again in 2024, our results show they were remarkably predictable over 6 months in advance,” said co-author Edward Blanchard-Wrigglesworth, a UW research associate professor of atmospheric and climate science.
Antarctic sea ice is important because it affects marine and coastal ecosystems and interactions between ocean and atmosphere in the Southern Ocean. It also affects global climate by reflecting sunlight in the Southern Hemisphere and influencing ice sheets and global currents.
“Antarctic sea ice is a major control on the rate of global warming and the stability of ice on the Antarctic continent,” Espinosa said. “In fact, the sea ice acts to buttress ice shelves, increasing their stability and slowing the rate of global sea level rise. This ice is also important for marine and coastal ecosystems.”
As summer arrives in the Southern Hemisphere, the current sea ice extent remains sparse around Antarctica, close to a record low for this time of the year.
“Our success at predicting these major sea ice loss events so far in advance demonstrates our understanding of the mechanism that caused them,” said co-author Cecilia Bitz, a UW professor of atmospheric and climate science. “Our model and methods are geared up to predict future sea ice loss events.”
The research was funded by the National Science Foundation and the U.S. Department of Energy.
Journal Reference:
Espinosa, Z.I., Blanchard-Wrigglesworth, E. & Bitz, C.M. ‘Understanding the drivers and predictability of record low Antarctic sea ice in austral winter 2023’, Communications Earth & Environment 5, 723 (2024). DOI: 10.1038/s43247-024-01772-2
Article Source: Press Release/Material | University of Washington
Other science articles published this week
Permafrost thaw subsidence, sea-level rise, and erosion are transforming Alaska’s Arctic coastal zone (R. Creel, J. Guimond, B.M. Jones, D.M. Nielsen, E. Bristol, C.E. Tweedie, P.P. Overduin (2024) Proceedings of the National Academy of Sciences 121 (50) e2409411121 | DOI: 10.1073/pnas.2409411121)
Texas: A green hydrogen hub to decarbonize the United States and beyond (H. Lin, A. Hernandez Gonzalez, C.P. Nielsen, M.B. McElroy, (2024) Proceedings of the National Academy of Sciences 121 (50) e2321347121 | DOI: 10.1073/pnas.2321347121)
Permafrost instability negates the positive impact of warming temperatures on boreal radial growth (R. Alfaro-Sánchez, A.D. Richardson, S.L. Smith, J.F. Johnstone, M.R. Turetsky, S.G. Cumming, J.M. Le Moine, J.L. Baltzer (2024) Proceedings of the National Academy of Sciences 121 (50) e2411721121 | DOI: 10.1073/pnas.2411721121)
Study on the coupling coordination characteristics and influencing factors of ecological environmental civilization and resident public health in China – based on a modified coupling coordination model ( Xie Q, Wang Y, Zhang Y (2024) PLoS ONE 19 (12): e0315373 | DOI: 10.1371/journal.pone.0315373)
Responses of fisheries ecosystems to marine heatwaves and other extreme events (Marshak AR, Link JS (2024) PLoS ONE 19 (12): e0315224 | DOI: 10.1371/journal.pone.0315224)
Assessment of the viability of photovoltaic system implementation on the New Media Tower of Universitas Multimedia Nusantara using PVSyst software: A feasibility study (Saputri FR, Robert N, Akbar AM (2024) PLoS ONE 19 (12): e0314922 | DOI: 10.1371/journal.pone.0314922)
Difference in summer heatwave-induced damage between desert native and urban greening plants in an arid desert region (Li B-R, Sun N, Xu M-S, Sun Q-X, Wang H-M, Zhou J, et al. (2024) PLoS ONE 19 (12): e0299976 | DOI: 10.1371/journal.pone.0299976)
An assessment of mangrove forest in northwestern Mexico using the Google Earth Engine cloud computing platform (Valderrama-Landeros L, Troche-Souza C, Alcántara-Maya JA, Velázquez-Salazar S, Vázquez-Balderas B, Villeda-Chávez E, et al. (2024) PLoS ONE 19 (12): e0315181 | DOI: 10.1371/journal.pone.0315181)
The role of telemedicine towards improved sustainability in healthcare and societal productivity in Turkey (Özen F, Kaynar AH, Korkut AK, Teker Açıkel ME, Kaynar ZD, Kaynar AM (2024) PLoS ONE 19 (12): e0314986 | DOI: 10.1371/journal.pone.0314986)
Rare earth elements distribution in the river sediments of Ditrău Alkaline massif, Eastern Carpathians (Coțac VN, Iancu OG, Necula N, Sandu MC, Loghin AA, Chișcan O, et al. (2024) PLoS ONE 19 (12): e0314874 | DOI: 10.1371/journal.pone.0314874)
Featured image credit: kjpargeter | Freepik


