A study by ISGlobal analyses 919 European cities and their environmental quality, CO2 emissions and impact on human health.
By Barcelona Institute for Global Health (ISGlobal)
What types of cities exist in Europe and which are more favourable in terms of human health, environmental quality and carbon footprint? To answer these questions, a study led by the Barcelona Institute for Global Health (ISGlobal), a centre supported by the ‘la Caixa’ Foundation, has analysed 919 European cities.
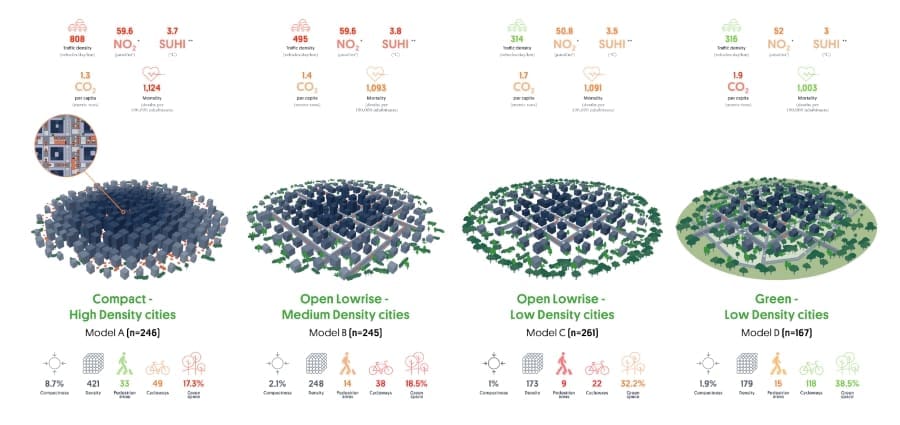
The research, published in The Lancet Planetary Health, identified four basic urban configurations on the continent: compact-high density cities, open lowrise-medium density cities, open lowrise-low density cities and green-low density cities.
The results show that greener and less densely populated cities have lower mortality rates, lower air pollution levels and lower urban heat island effect, but higher carbon footprints per capita. In contrast, high-density compact cities have higher mortality rates, less green space, poorer air quality and a stronger urban heat island effect, but lower greenhouse gas (CO2) emissions per capita.

Compact, high-density cities
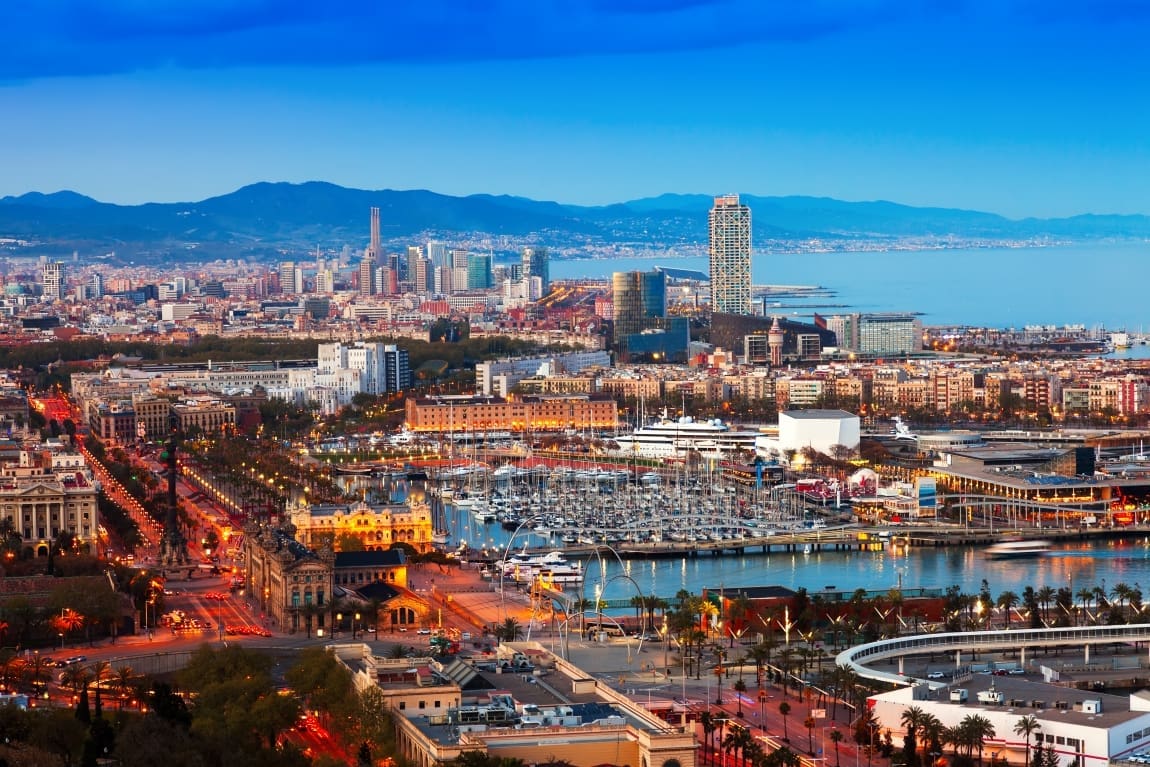
Compact cities are characterised by small surface area sizes and a high population density. In addition, they tend to have a high density of pedestrian areas, a moderate cycleway density and a low availability of green natural areas. It is the urban typology with the highest number of inhabitants in Europe (more than 68 million). Barcelona, Milan, Paris and Basel are examples of this urban typology.
Cities of this type tend to facilitate short-distance mobility, as they usually have dense public transport networks and infrastructure for walking and cycling. For these reasons, in recent literature, the compact city has emerged as the optimal theoretical model to promote healthier and more sustainable cities.
Open lowrise, medium density cities
Open lowrise, medium density cities have small surface area sizes, medium population densities and a relatively higher density of roads for motorized traffic. The availability of pedestrian areas, cycleways and green areas is intermediate, compared to other city types. Brussels, Dublin or Leipzig are examples of such cities.
Open lowrise, low density cities
Open lowrise low density cities occupy a larger surface area than the two previous typologies and have a lower population density. They are also characterised by a low availability of pedestrian areas and cycleways and moderate to high availability of green natural areas towards the outskirts. Pisa, Oviedo or Toulouse are examples of open lowrise low density cities.
Green, low-density cities
Lastly, the low-density green city is characterised by a large surface area size with a low population density. These sprawled cities are characterized by moderate availability of pedestrian areas and high availability of cycleways and natural green spaces, integrated from the central parts of the urban area. Helsinki, Rennes, Aarhus or Stockholm are examples of cities in this group.
City types comparison
Among the four city types, Compact-High Density and Open Lowrise-Medium Density cities exhibited the highest motorized traffic flows, resulting in the greatest levels of adverse exposure to air pollution and urban heat island effect. Accordingly, these cities also had the highest mortality rates. On the positive side, the concentration of people and services in a smaller space leads to better energy efficiency, so compact cities are also the type of city with the lowest CO2 emissions per capita.
In contrast, Green-Low Density cities exhibited the lowest urban heat island effect and air pollution levels, resulting in lower mortality rates. However, as sprawled conurbations, they require longer commutes and are less energy efficient, making them the costliest type of city in terms of carbon footprint per capita.
| Compact-High Density Cities | Open Lowrise-Medium Density Cities | Open Lowrise-Low Density Cities | Green-Low Density Cities | |
| Number of cities | 246 | 245 | 261 | 167 |
| Total population | 68,096,496 | 56,108,876 | 38,559,619 | 27,474,508 |
| Average population count | 276,815 | 229,016 | 147,738 | 164,518 |
| Average area size (km2) | 126 | 128 | 148 | 206 |
| Traffic density (vehicles/day/km) | High (808) | Medium (495) | Low (314) | Low (316) |
| NO2 (μmol/m2) | High (59.6) | High (59.6) | Medium (50.8) | Medium (52) |
| CO2 (metric tons per capita) | Medium (1.3) | Medium (1.4) | Medium/high (1.7) | High (1.9) |
| SUHI (ºC) | High (3.7) | High (3.8) | Medium /high (3.5) | Medium/low (3) |
| Mortality (deaths per 100,000 inhabitants) | High (1,124) | Medium/high (1,093) | Medium/high (1,091) | Low (1,003) |
| Compactness (% of city area dedicated to dense built-up structures) | High (8.7) | Low (2.1) | Low (1) | Low (1.9) |
| Density (mean population/250 m2 grid cell) | High (421) | Medium (248) | Low (173) | Low (179) |
| Pedestrian areas (average length in m/250 m2 grid cell) | High (33) | Medium (14) | Low (9) | Medium (15) |
| Cycleways (average length in m/250 m2 grid cell) | Medium (49) | Medium (38) | Low (22) | High (118) |
| Green space (average % of total city surface) | Low (17.3) | Low (18.5) | Medium/High (32.2) | High (38.5) |
Most of the population in the study resided in compact high density (n=68,096,496) and open lowrise medium density (n=56,108,876) cities, compared with the open lowrise low density (n=38 559 619 ) and green low density (n=27,474,508) city types.
Leveraging compact cities
“After analysing more than 900 cities in Europe, we believe that, as the literature and experts point out, the compact city may still be the model of the future, but in their current configuration, they show a poor environmental quality and need to overcome important challenges”, says Tamara Iungman, ISGlobal researcher and one of the lead authors of the study. “The potential for reduced car dependency, walkability or access to services and opportunities for social interaction are clear advantages of the compact city model. However, compact cities still show a high presence of motorised transport and a distinct lack of green spaces”, she adds.
“High air pollution levels are a particular challenge for compact cities and a reduction in the levels will reduce the mortality rates significantly”, says Sasha Khomenko, ISGlobal researcher and co-lead author of the study.
“We must leverage the potential of our compact cities through innovative models, such as superblocks, low-traffic or car-free neighbourhoods, incorporating alternatives such as nature-based solutions, including planting trees and green roofs and facades. It is essential to reduce car use and shift even more to active and public transportation. Of course, there is no one-size-fits-all solution for all cities. Each city should carry out specific studies based on its own characteristics and design an ad hoc solution to find the optimal model in terms of health, environmental quality and carbon footprint”, says Mark Nieuwenhuijsen, head of the Climate, Air Pollution, Nature and Urban Health programme at ISGlobal and senior author of the study.
Methodology
The study analyzed 919 European cities included in the 2018 Urban Audit database.
The area of each city was divided into five concentric rings for a detailed analysis of each of the variables. The morphological configuration of each of the rings was made using a standardised classification based on satellite imagery; the design and intended use of each street was extracted from the OSM database; traffic volume was obtained from the Open Transport Map (OTM) database; given the limited availability of ambient temperature data, the team opted to use land surface temperature to calculate the surface heat island effect (SUHI) as an indicator of the urban heat island effect, expressed as the difference in degrees Celsius between the city and the surrounding rural areas.
Similarly, as an indicator of air pollution, tropospheric NO2 levels were obtained from the Sentinel-5P satellite; CO2 emissions were extracted from the ODIAC inventory; and natural cause mortality rates at city level were obtained from previous studies using the Eurostat database.
Some of the data collected by the team in previous studies are publicly available on isglobalranking.org
More information: Iungman T, Khomenko S, Pereira Barboza E, Cirach M, Gonçalves K, Petrone P, Erbertseder T, Taubenböck H, Chakraborty T, Mark Nieuwenhuijsen M., ‘The impact of urban configuration types on urban heat islands, air pollution, CO2 emissions, and mortality in Europe: a data science approach’, The Lancet Planetary Health (8: e489–505; July 2024); DOI: 10.1016/S2542-5196(24)00120-7. ISGlobal Press Release. Featured image credit: bearfotos | Freepik


